The strategic value of sample testing
In 3D printing services, sample testing is a key quality control node before mass production. According to industry data, for projects without sufficient sample testing, the defective rate in mass production is as high as 15%-25%. However, through systematic testing, the defective rate can be reduced to less than 3%. The core value of sample testing is to verify process feasibility, discover design defects, confirm quality standards, and reduce batch risks.
Dimensional accuracy measurement system
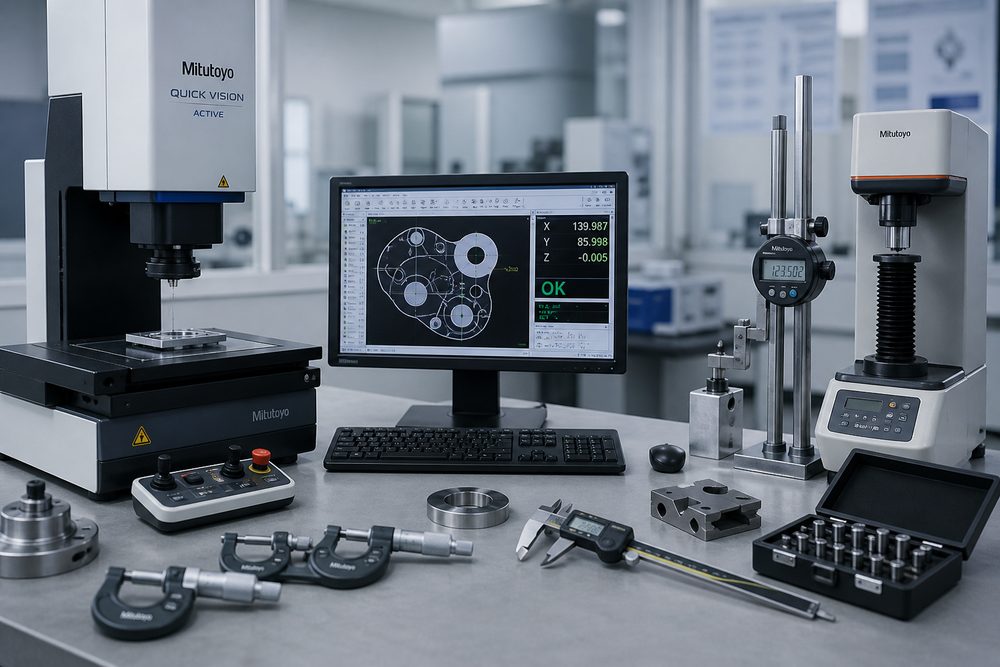
Measurement equipment selection: Select measurement tools according to accuracy requirements. For low precision requirements (±0.5mm), use vernier calipers and steel rulers; for medium precision (±0.1mm), use digital calipers and height rulers; for high precision (within ±0.05mm), use three-dimensional coordinate measuring machines and image measuring instruments. Establish an equipment selection matrix to match accuracy and cost.
Key dimension identification: Identify functional dimensions, matching dimensions, and assembly dimensions from drawings or 3D models. These dimensions have the greatest impact on product performance and need to be measured carefully. It is recommended to color-code key dimensions to form a priority list of measurements.
Measurement method specifications: Clarify the measurement location, measurement direction, and number of measurements. Average multiple measurements of the same size to reduce human error. Record measurement data, generate dimensional deviation distribution maps, and evaluate process stability.
Surface quality evaluation standards
Appearance defect detection: Under a standard light source, inspect defects such as layer lines, support marks, warping deformation, burnt discoloration, pore cracks and other defects. Establish a defect sample database to provide a reference for visual judgment. Classify defects: minor (does not affect functionality), moderate (requires repair), serious (scrap).
Surface roughness measurement: Use a roughness meter to measure the Ra value and compare it with the design requirements. Typical roughness of different processes: FDM Ra12.5-25μm, SLA Ra3.2-6.3μm, SLS Ra6.3-12.5μm. If lower roughness is required, evaluate post-treatment options (sanding, sandblasting, coating).
Color and gloss inspection: For appearance parts, use a colorimeter to measure the color deviation (ΔE value) and visually inspect the gloss uniformity. Establish a color standard sample block as the acceptance comparison benchmark.
Mechanical property testing method
Tensile strength test: Make a standard tensile specimen (ASTM D638 or ISO 527) and test it on a universal testing machine. Record the elastic modulus, yield strength, and elongation at break. Compare with the nominal value of the material to evaluate whether the process parameters are optimal. Pay attention to the anisotropy of 3D prints and test the performance differences in different printing directions.
Bending Strength Test: A three-point bend test is used to evaluate the stiffness and bending resistance of a material. Pay special attention to the load-bearing capacity of cantilever structures and thin-walled structures. Calculate the safety factor based on the actual load to ensure sufficient design margin.
Impact Toughness Test: Evaluate a material’s ability to withstand impact using an Izod or simply supported beam impact test. This test is particularly important for impact-prone applications. Compare the impact toughness of different materials and different printing parameters to optimize process selection.
Hardness test: Measured using Shore hardness tester (elastic materials) or Rockwell hardness tester (rigid materials). Hardness is related to wear resistance and pressure resistance, and is an important reference index for material selection.
Functional verification test process
Assembly verification: Test-assemble the sample and mating parts to check the fit gap, installation smoothness, and connection strength. For interference fit and clearance fit, verify whether they meet the design intent. Record problems during the assembly process and provide feedback on design modification suggestions.
Kinematic mechanism test: Conduct motion trajectory test, friction coefficient measurement, and durability test on parts containing kinematic pairs. The number of operations is determined according to the application scenario, and is generally not less than 1.5 times the design life. Monitor wear and tear and evaluate maintenance intervals.
Sealing performance test: Carry out air tightness test or liquid tightness test on seals and pipe fittings. The test pressure is 1.5-2 times the working pressure, and the pressure holding time is not less than 30 minutes. Detect the leakage rate and determine whether the sealing requirements are met.
Environmental adaptability test: Simulate the actual use environment and conduct temperature cycle, humidity test, salt spray corrosion, UV aging and other tests. The test cycle is determined according to the application scenario. Automotive parts usually require 96-240 hours of salt spray testing, and outdoor parts require 500-1000 hours of UV aging testing.
Inspection data management and traceability
Inspection report preparation: Generate an inspection report for each sample, including: part information, inspection items, measurement data, qualification determination, inspection personnel, and inspection date. The report is archived for future reference and serves as the quality benchmark for mass production.
Data statistical analysis: Perform statistical analysis on the inspection data of multiple samples, and calculate the average, standard deviation, and process capability index (Cpk). Cpk>1.33 means that the process is stable and can enter mass production; Cpk
Submit a model, drawing, image or written notes. Engineers will review material, process, finishing and delivery based on actual use.