
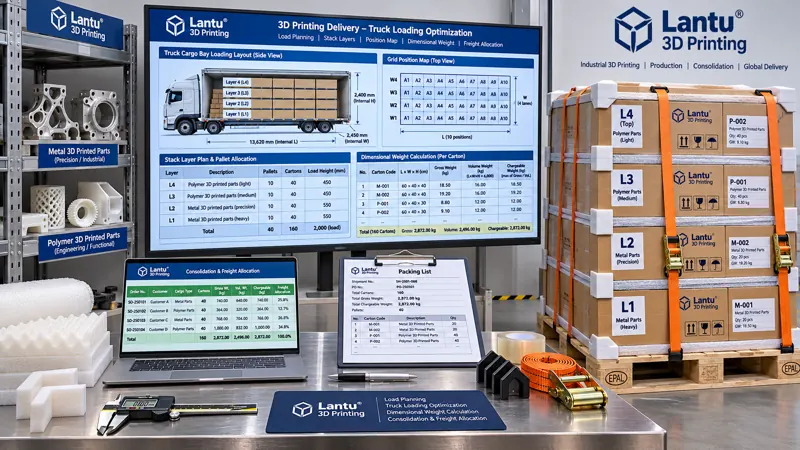
Introduction: Why per-part freight for the same order can differ by nearly twofold across two shipments
In lantu3D's delivery practice, the same batch of 300 nylon fixtures, shipped on the same line-haul route with the same carrier, incurred freight of CNY 18.6 per part when dispatched as a dedicated shipment. When later consolidated with sample shipments for two other customers and replanned based on volumetric weight, per-part freight fell to CNY 10.2. The parts did not change, the packaging did not change, and the protection level did not change; the only difference was how much billable space remained in the vehicle. 3D-printed parts are often low-density, irregularly shaped, and supplied with lattice openings and conformal packaging. Their actual weight may be low while their volume is substantial, so freight estimates based on weight intuition systematically underestimate cost. More problematic still, once shipments are consolidated, the allocation of costs among three orders, responsibility for signing off on vehicle utilization, and authority to determine stacking layers can all become sources of dispute during month-end reconciliation. This article transforms load planning and utilization from “the shipping operator's experience” into an auditable calculation sheet, covering volumetric weight, stacking constraints, shared-vehicle consolidation, and per-part freight allocation. It supports full lifecycle management from design data to physical delivery, rather than merely discussing techniques for loading goods onto a truck.
1. Lock down the three weight definitions first: actual weight, volumetric weight, and billable weight
The first step in any load-planning calculation is not vehicle scheduling, but standardizing definitions. Actual weight G is measured using a calibrated scale and includes pallets, reusable containers, cushioning liners, and document pouches, accurate to 0.1 kg. Volume V is calculated from the maximum external length, width, and height of each shipment unit, then multiplied by a non-fillable void factor k, rather than from the bounding box of the part itself. For 3D-printed parts with curved surfaces and lattice structures, k should be 1.15–1.35; use 1.05–1.10 for regular cartons and the upper end of the range for irregular parts after cushioning is added. This factor must be specified in the packaging work instruction and version-controlled; otherwise, two people can calculate volumes for the same part that differ by 20%. Volumetric weight Wv = V × k ÷ conversion factor. For line-haul road transport, a common rule is 1 m³ ≈ 333 kg, while air freight commonly uses 6000 and express services use 5000–8000; the applicable rule must follow the carrier's current rate sheet. A single formula must never be applied across all transport modes. Billable weight Wb = max(G, Wv), and all three values should be printed on the waybill. It is recommended to maintain four master-data fields—lane, conversion factor, rate version, and effective date—and automatically retrieve them before each quotation. Using an old conversion factor on a waybill after a rate-sheet revision is among the most common and hardest-to-detect errors in consolidated-shipment accounting.
2. Utilization is not simply “filling the truck”: three constraints come before volume
Vehicle utilization η is defined as occupied billable volume divided by the vehicle's effective volume, but both the numerator and denominator must first account for constraints. The first category is geometric constraints: internal vehicle length, width, and height less door frames, wheel arches, and loading/unloading clearance, generally leaving 50–100 mm on each side. Effective volume is Veff = (L−2δ)(W−2δ)(H−δtop). The second category is stacking constraints: carton compression strength and fragility-test results determine the maximum number of layers nmax, typically three to five. Cartons containing thin-wall, lattice, or unfinished resin parts must not be placed on the bottom layer, and separator boards must be used between layers; their thickness and weight must also be included in the occupied capacity. The third category is securing and access constraints: straps, anti-slip mats, and airbags consume 3%–8% of volume, while the rules of not placing heavy goods on light goods, not placing large goods on small goods, and loading later-delivery goods first create non-backfillable voids. Therefore, the practical formula is η = Σ(Vi×ki×ni×ui) ÷ (Veff×(1−r)), where ui is stacking utilization, generally 0.75–0.92 depending on nmax and same-layer balancing, and r is the securing reserve rate. As a practical target, full-truck utilization of η ≥ 0.78 qualifies as acceptable load planning; 0.65–0.78 requires written justification; and 20% between batches, a review must be triggered to determine whether the rate version, k value, or η changed. Allocation results should be written back to the order cost card alongside material, machine-time, and post-processing costs for the 3D-printed part, enabling quotation reviews.
6. Release gates and exception handling
Establish five D1–D5 release gates before dispatch. The vehicle may be sealed only after all gates pass: D1, dimensions and weight data match physical spot checks, with at least three items sampled per shipment and deviation ≤2%; D2, calculated η falls within the target range and the Load Confirmation Form is dual-signed; D3, stacking layers, securing photos, and the no-heavy-on-light check are verified layer by layer; D4, evidence for each of the five consolidation criteria is retained, and assessment documents plus temperature and humidity requirements remain valid; D5, the allocation method is frozen, reconciliation variance is ≤1%, and all three weight fields are complete on the waybill. Exceptions are handled in three states: State A, data-entry or label errors, are corrected and recalculated on site without changing the loading plan; State B, including low η, unbalanced layer weight, or an incorrect rate version, requires reloading or reallocation, and the vehicle-sealing approval is voided and re-signed; State C, including irreconcilable dangerous-goods classification conflicts, customer confidentiality conflicts, or unresolved oversize conditions, requires the entire shipment to be removed from consolidation and dispatched separately with the reason recorded. All A/B/C records must be archived under “load-plan number + timestamp + operator + reviewer” and linked with in-transit monitoring and proof-of-delivery records. Conduct a quarterly reverse-trace exercise: randomly select a historical waybill and trace backward from per-part freight to the layer number, k value, η, and allocation method. The first-pass rate should be ≥95%.
7. Implementation checklist and common pitfalls
A 30-day implementation can be divided into four weeks. Week 1: build master data, including vehicle effective volume, conversion factors and rate versions, k-value tables, and nmax-to-Gc mappings. Week 2: embed the nine-field load list and layer-layout diagram into shipping work orders. Week 3: launch allocation calculations and reconciliation-variance checks, then run three real consolidated-shipment batches. Week 4: audit the D1–D5 gates and conduct a reverse-trace exercise. Perform eight self-checks: whether every item uses external dimensions including cushioning; whether actual, volumetric, and billable weights are distinguished; whether k values are linked to the packaging version; whether stacking-layer limits have test evidence; whether η includes securing reserves; whether consolidation passed all five criteria; whether the allocation method is frozen and reconciled; and whether layer numbers and photos can be traced back from per-part freight. Five common pitfalls are using the part bounding box as outer-carton volume, applying one conversion factor to both air freight and line-haul transport, treating “filled to capacity” as an acceptable η criterion, considering only direction while ignoring confidentiality and cleanliness compatibility in consolidation, and allocating freight by memory at month-end. All can be exposed through a single confirmation form and one reverse-trace exercise.
Conclusion
The value of load-planning and utilization accounting is not simply to fill vehicles more completely. It is to turn “how much billable space this shipment occupied, how much freight it should bear, and which layer it occupied” into engineering facts that can be signed, audited, and traced. For a full-lifecycle platform such as lantu3D, spanning design through physical delivery, volumetric-weight definitions, stacking constraints, the five consolidation criteria, allocation reconciliation variance, and D1–D5 release gates are all part of the delivery evidence chain, just like process parameters and inspection records. Lock down the definitions, map the layer numbers, and reconcile the variance, and per-part freight becomes usable data for quotation and process decisions rather than an unexplained month-end expense.
Submit a model, drawing, image or written notes. Engineers will review material, process, finishing and delivery based on actual use.