
Introduction: Two Powders Behind the Same Certificate of Analysis
Two suppliers provide Ti6Al4V powder. Both certificates of analysis state D50 = 35 μm, oxygen content 0.12%, and good sphericity, while the prices differ by 18%. Yet their in-machine performance is entirely different: Batch A spreads uniformly, produces continuous melt tracks, and maintains density above 99.6%; Batch B frequently produces recoater streaks, with lack-of-fusion defects rising from 0.3% to 2.7%, resulting in the rejection of 9 parts from a 60-piece order.
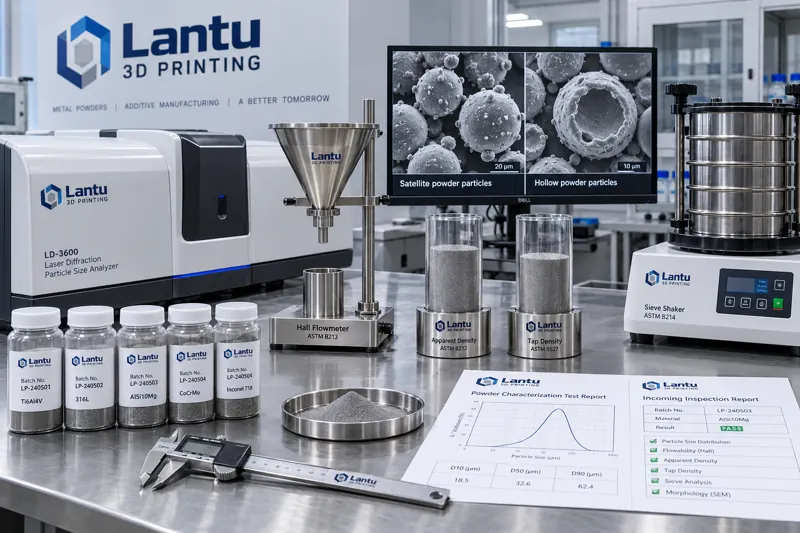
The issue is not necessarily fraud, but that the four indicators listed on the certificate are fundamentally insufficient to describe powder behavior. D50 provides only the median of the particle-size distribution, not the distribution width or fine-particle tail; “sphericity” is an unquantified description; and oxygen content measures the chemistry of the entire powder package, not argon trapped inside hollow particles. What actually determines powder spreading and melting behavior is a measurable set of physical properties: particle-size distribution profile, apparent and tap density, Hall flow rate, and the proportions of satellite and hollow particles.
1. Particle-Size Distribution: Three Numbers Beyond D50
A laser diffraction particle-size analyzer provides a volume-weighted distribution. At least four values should be reviewed: D10, D50, D90, and span (D90-D10)/D50. A typical LPBF range is D10 ≈ 15–20 μm, D50 ≈ 30–40 μm, and D90 ≈ 55–65 μm, with span controlled between 1.2 and 1.8.
The two tails are the real risks. An excessively low D10 value (too many fines) has three consequences: increased specific surface area and oxygen adsorption, poorer powder flowability and uneven layer thickness, and substantially more spatter and fume during laser scanning. The protective-lens replacement interval may decrease from 400 hours to 250 hours. An excessively high D90 value (too many coarse particles) can create dragging scratches beneath the recoater blade, while coarse particles can also locally cause lack of fusion.
A practical criterion is that a batch with D10 below 12 μm or D90 above 70 μm should be classified as requiring disposition, even if D50 falls within specification. Reused powder requires particular attention to particle-size drift: sieving removes coarse particles, while fines accumulate with repeated reuse. Therefore, after more than five reuse cycles, the D10 of powder is typically 3–6 μm lower than that of virgin powder.
2. Apparent and Tap Density: Primary Indicators for Powder Layers
Apparent density is the density of freely packed powder. For Ti6Al4V, it is typically 2.3–2.6 g/cm³, approximately 52–58% of theoretical density. Tap density is measured after a specified number of taps and is generally 2.8–3.1 g/cm³. Their ratio is known as the Hausner ratio, one of the lowest-cost indicators of flowability:
Hausner ratio < 1.25 → good flowability and suitable for direct machine use; 1.25–1.40 → moderate flowability, requiring lower spreading speed or more recoater compaction passes; > 1.40 → poor flowability and non-uniform powder-layer density, not recommended for thin-layer processes of 20–30 μm.
Apparent density directly determines the actual powder mass in each layer. Consider a machine with a 30 μm layer thickness and a 250 × 250 mm build area: if apparent density falls from 2.5 to 2.2 g/cm³, powder mass per layer decreases by approximately 12%. With unchanged laser energy input, this is equivalent to a 12% increase in energy density—one reason why the same parameter set may work with virgin powder but produce keyholing with reused powder. Therefore, energy density must be rechecked whenever changing powder batches or powder types, rather than reusing the previous batch's process card.
3. Hall Flow Rate: Converting Flowability into a Decision-Making Number
A Hall flowmeter measures the time required for 50 g of powder to pass through a standard funnel with a 2.54 mm orifice, expressed in s/50 g. This is the standard method specified in ASTM B213 and one of the easiest tests to include on an incoming-inspection form.
Reference ranges are as follows: spherical gas-atomized powders such as Ti6Al4V and 316L typically measure 15–25 s/50 g; 316L is slightly faster at 13–20 s/50 g; and AlSi10Mg, due to its lower density and tendency to bridge, typically measures 25–40 s/50 g. Values above 45 s/50 g, or interrupted flow caused by bridging or intermittent discharge, should be rejected outright. Such powders will produce periodic powder starvation beneath the recoater blade.
Two measurement pitfalls require attention. First, the powder must be dry: when moisture content exceeds 0.05% by mass, liquid-bridge forces between particles can worsen Hall flow rate by 20–40%. Powder should therefore be vacuum-dried at 80–120°C for 2–4 hours, cooled to room temperature in a desiccator, and tested immediately. Second, reused powder should be sieved first; otherwise, residual agglomerates and spatter particles may block the funnel orifice, measuring blockage time rather than actual flow time.
4. Satellite and Hollow Particles: Quantifying Morphological Defects
During gas atomization, small droplets can adhere to the surface of larger solidified particles, forming satellite particles. Their impact is twofold: they increase mechanical interlocking between particles and impair flowability; during spreading, these protrusions hinder particle rearrangement and reduce powder-layer density. Hollow particles are closed-pore particles formed when atomization gas becomes entrained inside molten droplets. They may show no abnormality during powder spreading, but can rupture in the melt pool and release gas, forming spherical pores—defects often misdiagnosed as process-parameter issues.
Two quantification routes are available at different cost levels. Low-cost route: after metallographic preparation, randomly capture 10 fields of view at 500× magnification, count at least 200 particles per field, and calculate the proportions of satellite particles (particles with distinct attached spheres on their surfaces) and hollow particles (particles with closed pores visible in cross-section). Recommended thresholds are satellites ≤ 8% and hollow particles ≤ 1.5%. High-resolution route: use SEM with automated image analysis to generate both sphericity (circularity) distribution and joint particle-size/morphology distribution. Measurement time is approximately 20–30 minutes per sample, making this approach suitable for first-batch qualification of new suppliers.
Hollow particles also have an indirect indicator: apparent density is significantly below the historical value for the same batch type while particle-size distribution remains unchanged. For example, one batch of 316L showed an apparent density of 4.0 g/cm³ versus a historical mean of 4.4 g/cm³, while D50 and span were both normal. Retesting found a hollow-particle proportion of 3.8%. Hollow particles reduced packing density, making this the most economical early-warning signal.
5. Coupling of Specific Surface Area and Oxygen Pickup
BET specific surface area is a sensitive indicator of fine-particle content. For spherical Ti6Al4V with D50 = 35 μm, the theoretical geometric specific surface area is approximately 0.02 m²/g. If the measured BET value reaches 0.05–0.08 m²/g, it indicates a substantial fine-particle population, rough particle surfaces, or satellite structures. For the same exposure conditions, doubling the specific surface area approximately doubles the oxygen pickup rate. This is why batches with higher fine-particle content exhibit faster oxygen increases after opening.
Incoming inspection should establish a coupled criterion: when BET specific surface area is more than 30% above the historical average, the post-opening use window should be reduced from the standard 30 days to 14 days even if oxygen content meets specification, and an additional drying step should be added before machine use.
6. An Actionable Incoming-Inspection Checklist
Organizing these indicators into a decision-based form is far more effective than discussing “good sphericity.” Six tests should be mandatory for every batch, with two additional tests conducted on a sampling basis:
Mandatory tests: ① particle-size distribution D10/D50/D90 and span; ② apparent and tap density, including Hausner ratio calculation; ③ Hall flow rate (s/50 g, average of three repetitions); ④ oxygen and nitrogen content (inert gas fusion with infrared/thermal-conductivity detection); ⑤ moisture content (Karl Fischer titration or loss on drying); ⑥ appearance and foreign matter inspection (white-cloth wipe test and magnetic separation check).
Sampling tests, triggered for the first batch from a new supplier or when process abnormalities occur: ⑦ metallographic/SEM determination of satellite and hollow-particle proportions; ⑧ BET specific surface area.
Acceptance rules must be written as thresholds rather than descriptive terms, and each item must specify the test-method standard and equipment. Otherwise, suppliers and purchasers will use different measurement methods and their data will never align. Retained samples are equally important: retain a sealed 200–300 g sample from each batch, labeled with batch number, receipt date, and test report number. Keep it until six months after the batch has been consumed. In the event of widespread defects, this is the only evidence available for traceability.
Conclusion
The core of powder acceptance is not simply measuring more indicators, but measuring the physical properties that affect powder spreading and melting, and converting them into decision-based thresholds. For particle-size distribution, evaluate the D10 and D90 tails rather than D50 alone; calculate the Hausner ratio from apparent and tap density, then determine whether energy density requires recalibration; use Hall flow rate as a firm flowability criterion; and quantify satellite and hollow particles through metallography or SEM, with apparent-density anomalies serving as a low-cost warning signal for hollow particles.
Within lantu3D's delivery system, powder characterization is not merely an incoming-inspection procedure; it is a prerequisite for establishing the process window—only when powder behavior is measurable can printing parameters be reproducible and delivery quality be assured.
Submit a model, drawing, image or written notes. Engineers will review material, process, finishing and delivery based on actual use.