
Introduction: An Invisible Seam Determines Whether Large Parts Can Be Delivered
When a part’s maximum envelope exceeds the effective scan field of a single machine, engineering teams generally have three options: split the part and join the sections afterward, use equipment with a larger build area, or stitch scan fields using a dual-laser or even four-laser system. The third option appears to be the most economical, but it is also the most likely to expose delivery-stage problems: samples taken separately from the two regions may both pass, yet a lack-of-fusion band, hardness-transition band, or surface step can appear in the handover zone between the two lasers. In one batch of large 316L brackets, density sampled in the stitch zone dropped from 99.6% in the main region to 97.8%; all tensile specimens fractured on the seam-crossing side, while metallographic records for single-track specimens were entirely normal. The root cause was neither insufficient power from one laser nor material-lot variation, but the fact that no one had ever managed the “stitch zone” as an independent controlled object. lantu3D treats the full journey from design blueprint to physical delivery as a lifecycle chain, and stitch-zone control is the link that translates equipment capability into assessable quality evidence.
This article does not address single-optical-path maintenance, such as galvo zeroing, protective-window transmittance, or power-degradation checks, nor process-window calibration under a single spot. Instead, it addresses the engineering layer unique to multi-laser systems: how the geometric overlap band between two scan fields, energy handover, timing synchronization, and release criteria for seam-crossing parts can be quantified, verified, and documented.
1. Define the Controlled Object First: A Stitch Zone Is Not a Line, but a Band
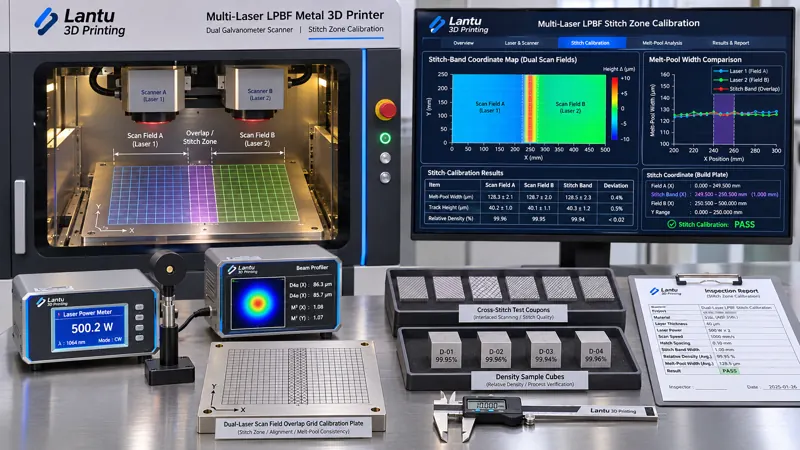
Most production shops interpret the stitch zone as the boundary line between scan fields, which is the starting point for misjudgment. In reality, the effective scan fields of two lasers contain a substantial overlap region at the boundary. For a typical stitched dual-galvo configuration with 250 mm × 250 mm scan fields, the nominal boundary may be x=0, but the repeatably coverable overlap band is commonly set at ±2 mm to ±5 mm. When galvo full-field positioning error, generally required to be no greater than ±50 μm, F-theta field distortion, and flatness deviations of the build platform and build cylinder are added, the true controlled object is a 4–10 mm-wide band rather than a zero-width geometric line.
The controlled-object definition should be included in the controlled process card and should, at minimum, lock six fields: machine ID and laser IDs; calibration version numbers for both scan fields; stitch-zone center coordinate and width, such as x=0±3 mm; overlap strategy (single-beam exclusive / dual-beam energy sharing / alternating-layer scanning); a list of part features permitted to cross the seam; and the first-article acceptance method for the band. Without these six fields, subsequent inspection data cannot answer the question, “Under which stitch-condition version was this value measured?”
2. Geometric Consistency: First Align Both Scan Fields to the Same Coordinate System
The first category of stitch-zone defects is positional error, not metallurgical defects. The recommended method is to use a standard grid calibration plate covering the full field. At build-plane height, scan the same set of reference points separately with both lasers, compare the measured point clouds with the theoretical grid, derive translation, rotation, scaling, and nonlinear distortion coefficients for each laser, and enter them into their respective compensation tables. A three-tier engineering criterion is recommended: a coordinate residual at the stitch-zone center of ≤30 μm between the two lasers permits direct production; 30–60 μm requires recalibration and confirmation with seam-crossing test specimens; and >60 μm prohibits scheduling seam-crossing parts until the optical path and field lens have been reviewed.
A second commonly overlooked item is Z-axis consistency. If the focal planes of the two lasers differ by 0.3 mm, then, based on a nominal focal spot of 70–80 μm and the approximate condition in which 0.5 mm of defocus expands the spot beyond 120 μm, the actual powder-bed power-density difference can reach 50%. This appears as a narrowed melt width along the stitch zone. Therefore, after every protective-window replacement, field-lens replacement, or restart following an extended shutdown, the focal position and powder-bed spot diameter of both lasers must be remeasured, and measured values—not factory values—must be recorded. The third item is timing. When both lasers scan simultaneously, crossflow and plume can mutually obstruct each other, increasing the likelihood of spatter redeposition in the stitch zone. Crossflow velocity and the scan-start phase difference between the two lasers should therefore be included in the same work instruction, with a fixed sequence defining which laser scans first and which scans second.
3. Energy Handover: The Overlap Band Is Not Simply a 50/50 Power Split
The second category of defects arises from duplicated or missing energy input. If the overlap strategy assigns each beam to cover the region at 50% power, the energy actually reaching the powder bed does not equal 100% from a single beam. The measured power, spot diameter, defocus, scan speed, and overlap ratio of the two lasers differ, and the second beam scans a surface already preheated or even solidified by the first beam, under entirely different thermal boundary conditions. Engineering calibration should use measured energy density rather than nominal power allocation: E = P / (v × h × t), in J/mm³, where P is power measured at the powder bed rather than the laser’s rated value, v is scan speed, h is hatch spacing, and t is layer thickness.
An executable calibration route consists of three steps. First, conduct a single-track scan matrix: place one group of single-track specimens inside the stitch zone and another outside it, fix layer thickness at 30–50 μm, use 3–5 power and scan-speed levels within the process window, measure melt width, melt depth, and width-to-depth ratio, and identify the boundary of the dense region. Second, perform seam-crossing comparisons: print identical small test blocks in the overlap band using exclusive-beam, dual-beam energy-sharing, and alternating-layer strategies, then measure density—preferably cross-validated by metallographic image analysis and the Archimedes method—melt-pool width-to-depth ratio, and surface roughness Ra, selecting the option with the smallest deviation from the main region. Third, freeze the operating point with margin. For example, if the main region uses E=62 J/mm³ and the stitch zone uses E=60 J/mm³, the density difference must be ≤0.3 percentage points, melt-width difference ≤10%, and Ra difference ≤15%, while retaining at least a 10% margin from both the lack-of-fusion boundary and keyhole boundary. If any requirement is not met, narrow the band width and change seam-crossing features to exclusive single-beam scanning.
4. Inspection and Acceptance: Batch Seam-Crossing Parts Separately Rather Than Averaging Them into the Main Population
The third stitch-zone failure mode is being “averaged out.” If an inspection lot is randomly sampled across the entire build cylinder, no seam-crossing part may be sampled at all, or testing may cover only the main region. It is recommended to go one step beyond the concept of 11305 inspection lots by making geometric location one of the lot-definition dimensions. Any part with a CTQ feature located within ±3 mm of the stitch zone should be assigned to a separate seam-crossing sub-lot, supported by an independent location map and build-coupon location map. Specimens must be taken from within the stitch zone in both the seam-crossing direction, perpendicular to the boundary, and the vertical direction.
Release criteria should be written as four assessable requirements: ① perform visual and dimensional reinspection on every part in the seam-crossing sub-lot; the step height at the stitch zone must be ≤0.05 mm, with no continuous linear depression; ② inspect at least one part from each seam-crossing sub-lot by metallography or industrial CT, focusing on lack of fusion and porosity in the three layers above and below the relevant event layer; the difference in porosity between the band and the main region must be ≤0.2 percentage points; ③ tensile or hardness specimens must be taken in the seam-crossing direction; fractures must not all occur in the stitch zone, and strength must be no less than 95% of the mean value for the main region; ④ maintain a complete record chain, including calibration version, measured power and spot size for both lasers, overlap strategy, gas-flow velocity, build number and layer number, specimen ID, and reviewer. If any item is missing, the sub-lot is not released. It must be isolated and processed through the MRB nonconforming-material procedure; concession release is not permitted.
5. Recalibration Triggers and the Ledger: Allow Equipment-State Changes to Automatically Freeze Scheduling
Stitch-zone control is not a one-time calibration exercise, but ongoing state maintenance. Six recalibration triggers are recommended: replacement of a protective window or field lens; power deviation >5% for either laser; galvo recalibration; machine relocation or restart after an extended shutdown; completion of annual geometric-accuracy calibration; and same-side deviation in two consecutive seam-crossing sub-lots. Once triggered, scheduling for all seam-crossing orders must be frozen. The grid calibration plate and seam-crossing comparison test blocks must be rerun, and scheduling can resume only when both return within acceptance criteria.
The ledger should use six keys: “machine—laser pair—calibration version—stitch-zone coordinates—strategy version—validity start/end time.” Each build record must be traceable to the version in effect at that time. The dashboard should retain only five indicators: coordinate residual between the two lasers; density difference between the stitch zone and the main region; first-pass release rate for seam-crossing sub-lots; first-article pass rate after recalibration; and the proportion of nonconforming product related to seam crossings. The data must enter the same evidence chain as model hashes, parameter-package versions, and calibration validity periods; otherwise, they are merely equipment logs.
6. Implementation Checklist and Common Misconceptions
The recommended deployment sequence is as follows: in Week 1, complete scan-field grid calibration and freeze the band width, establishing a stitch-zone coordinate map; in Week 2, run the single-track matrix and compare the three overlap strategies to select an operating point; in Week 3, incorporate seam-crossing sub-lots, location maps, and specimen orientations into inspection-lot rules and process cards; in Week 4, connect the ledger and recalibration triggers, then introduce an intentional offset—for example, shifting one compensation table by 40 μm under approved machine safety procedures—to verify that the control system intercepts it effectively. Four common misconceptions are: looking only at single-beam power rather than measured powder-bed energy density; treating calibration-plate results as permanently valid; failing to stratify sampling by location; and broadly attributing seam-crossing defects to “poorly adjusted process parameters,” repeatedly tuning parameters without checking geometry and timing.
Conclusion
The value of multi-laser stitching is expanded deliverable build area; its risk is turning a 4–10 mm-wide band into a quality blind spot. The solution is not simply further parameter tuning, but defining the stitch zone as an independent controlled object: geometrically align it to a common coordinate system, calibrate overlap strategies using measured energy values, inspect and batch parts separately by location with seam-crossing acceptance criteria, and use a six-key ledger and recalibration triggers to freeze scheduling. Only when a third party can recalculate such facts as the coordinate residual between the two lasers, the density difference within the band, and the calibration version used for a given seam-crossing part does a large component truly possess verifiable evidence from digital model to physical delivery, rather than an isolated certificate of conformity.
Submit a model, drawing, image or written notes. Engineers will review material, process, finishing and delivery based on actual use.