
Introduction: Why Does the Same CMM Pass in the Morning but Fail on Retest in the Afternoon?
In the 3D-printing delivery chain, dimensional disputes often arise not because the part has changed, but because the measurement environment has changed. A coordinate measuring machine (CMM) measures the flatness of an assembly surface at 0.06 mm in the morning, yet a retest in the same fixturing orientation yields 0.11 mm in the afternoon. A roughness tester measures the same polished test coupon five consecutive times, with Ra values fluctuating between 1.6 μm and 2.4 μm. If the issue is attributed solely to gauge drift or operator performance, process capability is often misjudged. For additively manufactured parts such as conformal-cooling inserts, lattice thin-wall components, and porous metal sealing surfaces, measurement forces are low, sampling density is high, and feature scales often fall between a few micrometers and several tens of micrometers. Environmental micro-vibration can therefore be directly superimposed on raw point clouds and profile curves.
lantu3D views the path from design drawings to physical delivery as a verifiable lifecycle chain, with inspection data serving as release evidence within that chain. This article does not address equipment selection or gauge calibration intervals. Instead, it examines what justifies signing a measurement report based on the vibration condition of the floor and table at the exact moment of inspection in a precision inspection area: treating micro-vibration as a measurable state and defining measurement points, thresholds, shift-by-shift checks, data tagging, and retest trigger rules.
I. First Distinguish Three Levels: Equipment Foundations, Build Environments, and Inspection Micro-Vibration
In existing engineering articles, “vibration” commonly appears under three different subjects and must be separated. The first level is equipment installation and site acceptance testing (SAT): 10033 requires verification of foundation load capacity and site conditions before delivery to prevent precision drift after production starts; the annual calibration requirements in 10382 include foundation settlement and changes in surrounding vibration sources as report remarks indicating potential error sources. The second level is workshop environmental control (8582): temperature, humidity, cleanliness, and powder moisture absorption affect melt-pool stability and protect the built part. The third level is the focus of this article: the micro-vibration condition of the metrology room or precision inspection area, which protects whether measurement data can be used to determine conformity.
All three may use terms such as “foundation,” “vibration,” and “environment,” but their decision objects differ. SAT answers whether equipment can enter production; calibration answers whether machine axes remain accurate; environmental control answers whether powder will absorb moisture; micro-vibration control answers whether a given CMM point cloud, roughness profile, or set of industrial CT reconstruction slices has been contaminated by environmental noise. Treating the third level as a subordinate note to the first two leaves a missing link in release criteria.
II. Four Pathways Through Which Micro-Vibration Affects Measurement of Additive Parts
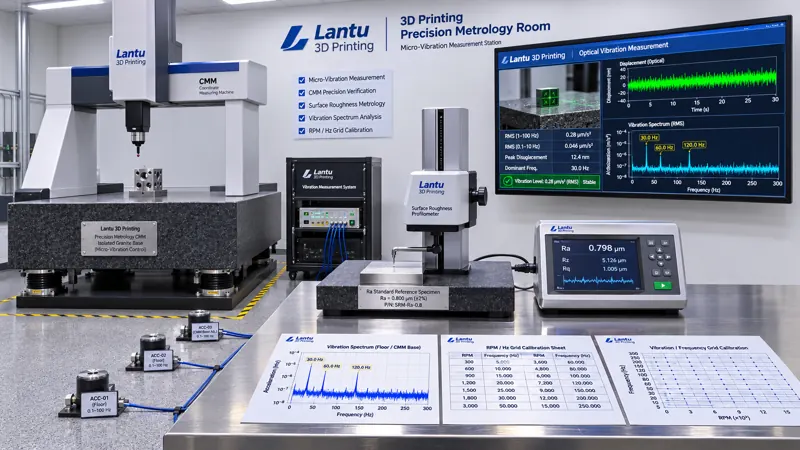
The first is contact profilometry. A stylus roughness tester scans a surface with a 2–5 μm tip radius. Unpolished LPBF side surfaces commonly have Ra values of 8–20 μm, while partially melted particles and layer-valley bottoms are already steep. Low-frequency table motion at 0.1–0.5 Hz or common plant disturbances at 20–80 Hz can be recorded as profile fluctuation, systematically increasing Ra and Rz. The second is CMM point-cloud measurement. Air-bearing guideways are sensitive to persistent micro-vibration; in scanning mode, relative displacement between the probe and workpiece changes trigger-point coordinates, and flatness criteria at the 0.05 mm level for thin-wall parts are particularly vulnerable. The third is optical measurement and CT. White-light interferometers and confocal microscopes reconstruct surface topography with submicron vertical resolution, and vibration during exposure or scanning can cause fringe misalignment. Industrial CT reconstruction slices may develop edge artifacts due to minute movement of the sample stage, which can be misread as lack of fusion or porosity. The fourth involves fine readings from balances, hardness testers, and alongside-build coupons, where micro-vibration compromises repeatability of 0.1 mg-level weighing and indentation-diagonal measurements.
As an empirical criterion, measure the same reference artifact 10 times each during a quiet window and a disturbance window. If the mean difference is less than 10% of the maximum permissible error and the standard-deviation ratio does not exceed 1.3, the inspection item may be considered insensitive to current vibration. Once the standard-deviation ratio exceeds 1.5 or the mean shift exceeds 10%, vibration status must be specified as a controlled condition of that measurement method rather than simply retesting and averaging the results.
III. Four Types of Measurement Points and Determinable Thresholds
A four-layer measurement-point layout is recommended: “source—transmission—table—instrument,” with all points linked to an inspection-area ID and timestamp. The first layer is floor vibration: install low-frequency accelerometers at the four corners of the metrology room and near the CMM base. Sample at ≥200 Hz and record RMS velocity (mm/s) and dominant frequency in the 1–80 Hz band. For general precision inspection areas, a VC (Vibration Criterion) target of VC-C or better is recommended, with equivalent RMS velocity controlled within 50 μm/s. Conduct an additional measurement during the nighttime baseline or equipment shutdown period for comparison. The second layer is the isolation table: measure transmissibility T=a_table/a_floor between the table and floor. In the 1–10 Hz band, T≤0.3 is acceptable, 0.3–0.6 requires observation, and >0.6 or the presence of a resonance peak requires the station to be taken out of service. The third layer is the instrument itself: record CMM air-bearing pressure, roughness-tester stylus force, and CT sample-stage repeatability in accordance with manufacturer inspection requirements. When vibration is abnormal, first rule out air-bearing and fastening conditions. The fourth layer comprises associated environmental variables: temperature of 20±1 °C, humidity of 45%±10% RH, pressure differential, and events such as personnel movement or forklift traffic. Use door sensors or a simple event button to timestamp these events so that they can be aligned with abnormal readings afterward.
Thresholds should not be made stricter than necessary. They may be classified by inspection item: Class A (CTQ dimensions, sealing-surface flatness, surface Sa≤1 μm) requires floor RMS≤25 μm/s, table T≤0.2, and no personnel movement event within 1 minute; Class B (general Ra and appearance dimensions) may allow RMS≤50 μm/s and T≤0.3; Class C (visual inspection and coarse positioning) requires recording only, with no interlock. Thresholds for each class should be written into the relevant inspection work instruction rather than displayed as generic slogans on a wall.
IV. Shift-by-Shift Inspection Logs and A/B/C Three-State Release
Implement micro-vibration control through a six-field log: inspection-area ID, measurement-point ID and calibration validity, actual RMS/T values for the shift, dominant frequency and spectrum screenshot filename, associated events (material handling/HVAC startup or shutdown/processing by adjacent equipment), and disposition status with signature. Before startup, perform a 10-run repeatability verification using a reference artifact and record the standard deviation. If deviation from the baseline of the previous acceptable shift exceeds 20%, suspend report issuance first.
Status is divided into three states. State A (release): all four layers of measurement points are within the relevant class thresholds, reference-artifact repeatability passes, and no associated event has occurred. Reports may be issued normally, and the vibration-status batch number is automatically included in the measurement record. State B (restricted use and retest): RMS or T slightly exceeds the limit but remains below 1.5 times the threshold, with no resonance peak. Only Class B/C inspections are permitted; Class A items must be retested during a quiet window. Both sets of raw data for the same part must be retained and must not overwrite one another, while the report must state the reason for retesting and both results. State C (hold): floor RMS exceeds twice the class threshold, a resonance peak appears on the table, air-bearing abnormalities occur, or the reference-artifact standard-deviation ratio exceeds 1.5. Immediately stop report issuance and place on hold all Class A data issued from that station after the last acceptable point. Review raw point clouds, profile curves, and CT slices; where necessary, retest retained samples. No concessionary release is permitted without conforming evidence.
V. Interfaces with Existing Quality Systems Rather Than Creating Another One
A micro-vibration log is not a second quality system. It adds a field to the existing evidence chain: “whether the environment was controlled when measurement occurred.” It connects with the 8499 gauge log and GR&R: reference-artifact data from interim checks must include a vibration-status batch number, otherwise gauge drift cannot be distinguished from environmental disturbance. It connects with the 11305 inspection batch and raw records: ALCOA+ requires contemporaneous, original, attributable records, so vibration-spectrum screenshots and event timestamps should also be retained as raw records with an audit trail for modifications. It connects with the 12084 outsourced-testing process: if an external laboratory report is used for Class A criteria, the purchase order should require the laboratory to provide the environmental vibration class during testing or at least declare conformance with environmental conditions specified by the method standard. It also connects with equipment calibration under 10382: “changes in surrounding vibration sources” in annual calibration reports should be upgraded from a remark to reproducible measurement-point values, with floor RMS measured and archived both before and after calibration.
A 30-day implementation schedule is recommended. In Week 1, select the inspection area, install measurement points, and collect a 7-day baseline to identify spectral characteristics of forklift routes and air-compressor startup and shutdown. In Week 2, incorporate A/B/C thresholds into three work instructions and improve station isolation and walking routes. In Week 3, connect the six-field log to work orders and report templates, then conduct a disturbance drill by intentionally starting an air compressor at an adjacent station. In Week 4, perform a 30-minute traceability drill: randomly select one released report and require traceability from the report number to the RMS value of that shift, spectrum screenshot, reference-artifact repeatability, and signatory. The target completeness rate is ≥95%.
VI. Common Failure Modes and Checklist
There are five common pitfalls: purchasing an isolation table without measuring transmissibility, allowing a resonance peak to fall within a frequently used frequency band; treating the SAT foundation-acceptance report as proof of long-term environmental conformity while ignoring new vibration sources after production-layout changes; recording only temperature and humidity but not personnel or forklift events, making abnormal readings impossible to attribute; using “retest and average” to conceal contaminated data, in violation of raw-record principles; and applying one plant-wide micro-vibration threshold, making Class A requirements too loose and Class C requirements too strict, increasing cost while failing to control disputes. The checklist can be condensed into seven questions: Are measurement points within calibration validity? Does the frequency band cover 1–80 Hz? Has table T been measured? Has the 10-run reference-artifact test been completed? Have associated events been tagged? Can the report be traced back to a vibration batch number? Does the State C hold scope begin from the last acceptable point?
Conclusion
As dimensional and surface criteria for additive parts become increasingly refined, minor disturbances in the measurement environment can no longer remain merely “remarks.” By separating micro-vibration in precision inspection areas into four measurable categories—floor RMS, table transmissibility, instrument status, and associated events—setting three-level A/B/C thresholds by inspection item, using shift-by-shift logs to link every report to its environmental condition at the time of measurement, and holding and reviewing data when limits are exceeded rather than averaging away the issue through retesting, CMM point clouds, roughness profiles, and CT slices can become genuinely reproducible, reusable, and verifiable release evidence. For lantu3D, this does not add merely another device; it completes the controlled condition of “the moment of measurement” in the evidence chain from digital model to physical delivery.
Submit a model, drawing, image or written notes. Engineers will review material, process, finishing and delivery based on actual use.