
Introduction: Utility Compressed Air Has Yet to Become a Separate Ledger
Over the past two years, lantu3D has refined its workshop energy accounting: electricity costs are split by peak/off-peak periods and demand charges; shielding gas for build chambers is allocated in m³ per part; recirculating cooling water is tracked by makeup-water volume and cycles of concentration; and carbon footprints are allocated by functional unit and shared-build contribution. Yet one utility has long remained buried in the common cost of "plant utilities," with neither dedicated metering nor a per-part accounting basis: utility compressed air for pneumatic valves, powder conveying, blasting, blow-off, and cylinders. An 11 kW screw compressor operating 4,000 hours annually incurs more than CNY 30,000 in electricity costs even at only CNY 0.70/kWh. If its load ratio is only 35%, nearly half of that electricity is wasted during unloaded idling. More troublesome, compressed-air leaks leave no water stains; they appear only as gradual pressure loss, sluggish pneumatic-valve response, or inconsistent blasting intensity, and are ultimately classified as "occasional equipment abnormalities." This article offers not energy-saving slogans, but a reproducible method based on specific power, load ratio, leak rate, submeter readings, and per-part utility compressed-air consumption, bringing compressed air into the same energy ledger as electricity, water, gas, and carbon.
1. Separate the Two Gases First: Shielding Gas and Utility Air Must Not Be Accounted for Together
A metal LPBF workshop has at least two gas systems with entirely different accounting bases. Calculating their consumption in a single table will inevitably produce errors. Process shielding gas is argon or nitrogen supplied to the build chamber. Its performance metrics include 99.999% purity, chamber oxygen content below 1,000 ppm (below 500 ppm for aerospace parts), and a dew point of ≤ −40 °C. It is measured in m³ per part, and its cost varies with chamber purge cycles and chamber volume. Utility compressed air is generated by compressors and distributed through a 0.6–0.8 MPa network to pneumatic valves, powder conveying systems, blasting cabinets, air guns, and cylinders. Its performance metrics are pressure, flow rate, oil and water content grades, and electricity consumption for air generation. It is measured in Nm³ per part. The former is a process-input condition; the latter is an energy utility. This article addresses only the latter. Compressed-air solid particle content, pressure dew point, and oil-content grade should be controlled according to ISO 8573-1. These fall within equipment-availability management and are referenced here only as prerequisites for acceptable air at the point of use.
2. Specific Power and Load Ratio: Oversizing Is the Largest Hidden Waste
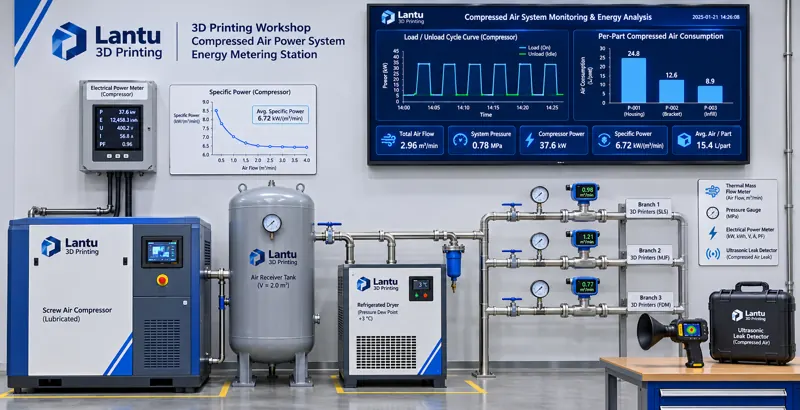
Compressor efficiency is not judged by appearance but by specific power: the electrical power consumed to produce 1 m³/min of compressed air, expressed in kW/(m³/min). A fixed-speed screw compressor with a discharge capacity of 1.6 m³/min and input power of 11 kW has a specific power of approximately 6.9. Top-tier efficiency models can achieve below 6.5, while units that have operated for more than eight years, have clogged intake filters, or suffer belt slip commonly range from 8.5 to 10. The first accounting step is to simultaneously measure electrical power P (kW) and discharge flow Q (m³/min) during a stable full-load period, then calculate SP = P/Q. Record data for three consecutive working days and use the median value rather than relying on nameplate data.
The second metric is the load ratio, η = T_load / (T_load + T_unload). This is where variable-speed and fixed-speed compressors differ: during unloading, a fixed-speed compressor motor continues to run, consuming approximately 30%–50% of full-load power while producing almost no air. Low-volume, high-mix workshops have pulsed air demand—blasting may be concentrated into ten minutes, while only intermittent pneumatic-valve operation occurs for the rest of the time. If a 3.0 m³/min oversized compressor is selected based on peak demand, the measured η is often below 40%. Engineering criteria are as follows: η continuously between 60% and 85% for two weeks is healthy; 40%–60% calls first for air-demand scheduling adjustments, such as consolidating blasting and blow-off into the same period; below 40%, with an existing receiver volume below 0.5 m³, warrants a variable-speed compressor or a large-small dual-compressor arrangement rather than simply replacing the unit with a larger compressor. Example: for an 11 kW unit with η=0.35 and unloaded power of 4 kW, annual unloaded electricity consumption at 4,000 h is approximately 4000×(1−0.35)×4 = 10400 kWh, or nearly CNY 7,300 for this item alone.
3. Leak Rate: Convert "Hissing" into Nm³/h and CNY/year
Leaks occur primarily at compression fittings, hoses, solenoid valves, filter-regulator units, push-to-connect fittings, and chamber-door seals, and increase approximately linearly with pressure. A practical quantification method is the shutdown pressure-hold test: close all air-consuming endpoints, pressurize the system to 1.1 times operating pressure without exceeding component rated pressure, record the total receiver and piping volume V (m³), pressure drop ΔP (MPa) over 30 minutes, and ambient atmospheric pressure P_atm (use 0.101 MPa), then calculate standard-condition leakage using Q_leak ≈ V·ΔP/(P_atm·t), where t is 0.5 h. Example: if V=0.8 m³ and the pressure drop over 30 minutes is 0.06 MPa, then Q_leak ≈ 0.8×0.06/(0.101×0.5) ≈ 0.95 Nm³/min—roughly equivalent to a 1.0 m³/min small compressor operating at full load all day. This alone can explain why total-meter air consumption cannot be reduced.
The criteria should be fixed in writing: Q_leak at ≤5% of rated air output is acceptable; 5%–10% shall be included in the monthly leak-inspection plan; and >10% requires line shutdown and corrective action. Locate leaks using an ultrasonic leak detector at fittings, soapy water on valve bodies, or a thermal mass flowmeter installed downstream of the main meter for baseline comparison during nighttime shutdown. Tag each leak and record its location, estimated opening size, and readings before and after repair to establish a leak register. The pressure-hold test must be repeated after repairs to close the loop; otherwise, "resolved" is merely a different description.
4. Submetering and Point-of-Use Breakdown: From the Main Meter to Branch Meters
An electricity meter on the compressor plus one main-line flowmeter provides only averages, leaving optimization without a target. A three-tier submetering system is recommended. The first tier is the air-generation side: a compressor input power meter plus a main-line vortex flowmeter, used to calculate specific power and total air production. The second tier is the branch side: at minimum, divide air use into the build-equipment branch (pneumatic valves, powder conveying, recoater-cylinder actuation), post-processing branch (blasting, blow-off, pneumatic grinding), and common auxiliary branch (dust-collector pulse cleaning, valve instrumentation), each equipped with a thermal mass flowmeter sampled at 1-minute intervals. The third tier is the event side: time-align pressure-transmitter readings with MES work-order status and build layer numbers to identify which operation is pulling down network pressure.
All metering must use the same standard conditions—20 °C, 101.325 kPa, and 0% relative humidity—and the conversion basis must be documented in the ledger. If field instruments display actual volumetric flow, readings must be converted using measured pressure and temperature; otherwise, data from different seasons cannot be compared. Install pressure measurement points before and after dryers and filters. A sustained differential pressure of >0.05 MPa should trigger filter-element replacement, preventing "insufficient pressure" from being misdiagnosed as compressor underperformance. The reconciliation difference between the sum of branch-meter readings and the main-meter reading should be ≤8%; a larger gap indicates an unregistered bypass, meter inaccuracy, or leakage.
5. Per-Part Utility Compressed-Air Consumption: Accepted-Delivery Basis and Shared-Build Allocation
The denominator for per-part utility compressed-air consumption must be consistent with electricity cost, water consumption, and carbon footprint: the number of accepted delivered parts during the accounting period, not the number of printed parts or the number of machine runs. The numerator is deducted according to attribution principles: q = (Q_total − Q_leak − Q_nonprod) / N_good, where Q_total is the accumulated standard-condition air production measured by the main meter during the accounting period; Q_leak is leakage calculated by the pressure-hold test and extrapolated by operating hours; Q_nonprod is separately metered non-production air use, such as maintenance air guns and air borrowed by other workshops; and N_good is the number of accepted delivered parts during the same period. Without these three deductions, q will be artificially inflated by weekend shutdowns and leaks, rendering month-to-month comparisons meaningless.
Shared-build allocation uses proxy weights consistent with those for recirculating water and carbon footprint, rather than dividing equally by part count. Each part receives a weight wi based on "scan time × number of layers × support and build-plate volume correction factor." The common pool—piping blow-off before purging, pneumatic actions during build-plate preheating, gas lines associated with witness coupons, and standby baseline air consumption—is allocated by wi. Directly attributable use, such as dedicated blasting time or individual blow-off records, is assigned directly to the relevant part. Example: for a build containing 12 parts, with a common pool of 8.4 Nm³ and a total weight of 42, a part with w=5 receives 1.0 Nm³. Adding 0.6 Nm³ of dedicated blasting gives q=1.6 Nm³/part. Ledger fields should include at least the accounting period, main-meter reading, leakage volume, non-production air use, accepted-part count, weight-table version, allocation result, and reviewer. Only by sharing the same accounting-period boundary as electricity, water, and carbon can these data form a complete per-part energy-cost card.
6. Release Criteria and Dashboards: Link Air Consumption to Build Layer Numbers
Air-consumption accounting must ultimately support release decisions. Three mandatory criteria should be written into work instructions. First, the process-pressure criterion: pause operation if branch pressure falls below 0.55 MPa during the build or fluctuates by >0.08 MPa within 1 minute. Record the corresponding build layer number, chamber position, and scan-job ID, then review recoating images, oxygen-content curves, and witness-coupon results for the affected chamber parts. Utility disturbances can support release decisions only when linked to specific parts; this follows the same logic as linking voltage sags to layer numbers. Second, the quality prerequisite criterion: if pressure dew point and oil-content grade at the point of use do not meet the agreed ISO 8573-1 grade, the affected utility air must not be included in the accepted-output denominator for q, preventing oil- or water-contaminated air from being counted as effective output. Third, the trend criterion: if q rises by >15% versus the average of the previous eight builds under the same process and weighting basis, or if specific power SP rises by >10%, freeze subsequent production scheduling for that machine type and initiate leak inspection and filter-element verification.
The dashboard should contain only five action-driving metrics: specific power SP (kW/(m³/min)), load ratio η (%), leak rate (% of rated air output), per-part utility compressed-air consumption q (Nm³/part), and per-part air electricity cost (CNY/part, = q × SP / 60 × electricity tariff). Produce monthly trends and issue weekly exception lists to equipment owners. For a platform such as lantu3D, covering the full lifecycle from blueprint design to physical delivery, upgrading utility compressed air from a "facility condition" to an energy utility that is measurable, allocable, and release-ready completes the final utility ledger after electricity, water, shielding gas, and carbon.
Conclusion
Waste in utility compressed air does not result from a single failed machine, but from four missing accounting bases: failure to separate shielding gas from utility air, failure to measure specific power and load ratio, failure to convert leaks into flow and cost, and failure to fully deduct total air production before allocating it to accepted parts. The recommended implementation sequence is: first, conduct a shutdown pressure-hold test to establish a leakage baseline; second, install three-tier air submeters and operate them for two full weeks; third, use η and SP to determine whether compressor configuration needs adjustment; and finally, incorporate q and shared-build weights into the same energy ledger and establish the three release criteria. At that point, the compressor is no longer merely the machine "always running" in the corner, but a verifiable data chain able to answer: how many Nm³ were allocated to this build, how much additional electricity cost was incurred, and on what basis is release permitted?
Invia un modello, un disegno, un'immagine o note scritte. Gli ingegneri valuteranno materiale, processo, finitura e consegna in base all'uso effettivo.