
Introduction: Customers Need More Than a “Green Manufacturing” Claim—They Need a Verifiable Carbon Figure per Part
More and more customers request a “product carbon footprint per part” from 3D printing service providers during quotations or annual supplier audits, expressed in kgCO2e/part, along with the functional unit, system boundary, and data sources. Many plants already have submetered electricity data, powder issue records, machine parameter packages, and scrap logs, yet the resulting figure often fails under scrutiny: How should electricity be allocated between one part and the dozen or more other parts on the same build plate? Should emissions from witness coupons, supports, scrap, and rework be included? Which year and version of the grid emission factor was used? The missing element is not data, but accounting rules that organize data into an auditable evidence trail. lantu3D treats the full process from blueprint and design through physical delivery as a lifecycle-management object. Carbon accounting should likewise use the same traceable engineering language rather than remain a marketing claim.
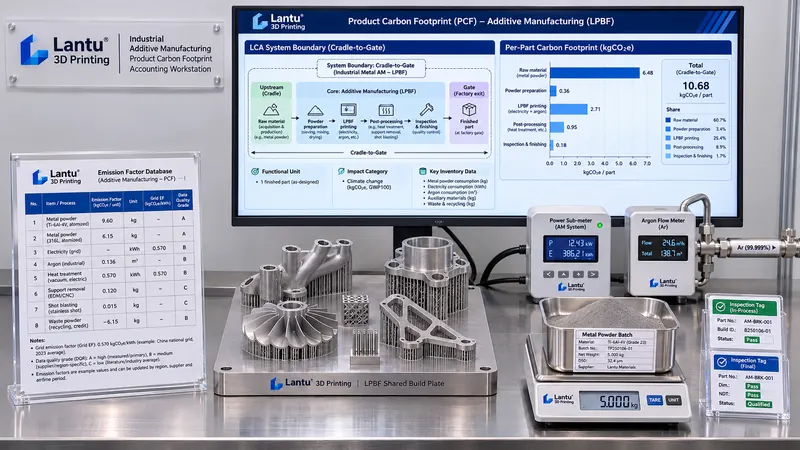
1. Define the Functional Unit and System Boundary First: Why “One Part” Is Not an Inherent Unit
The first step is not finding emission factors, but defining “one part” as a determinable functional unit. A recommended formulation is: one inspected and accepted part of a specified model, completed with required post-processing and packaging, delivered at the factory gate. The same declaration should specify the material grade, condition (as-built or heat-treated), CTQ list, and applicable technical-agreement version. The functional unit must be tied to accepted delivery; otherwise, whether scrap is allocated to accepted parts will produce two entirely different results.
A cradle-to-gate system boundary is recommended as a starting point, with four recorded stages: ① raw materials (cradle emissions of metal powder or resin, packaging, and transport); ② build processing (machine electricity, shielding gas, auxiliary equipment and standby power, build plates, and support material); ③ post-processing (support removal, heat treatment, machining, surface treatment, cleaning, and treatment of the three waste streams); and ④ inspection and delivery (inspection equipment, witness coupons, packaging materials, and internal logistics). For every stage within the boundary, state “included / excluded + rationale,” rather than drawing a flowchart with no explanatory text. The use phase and end-of-life phase may be excluded in an initial version, but the exclusions must be explicitly declared so customers do not mistake a factory-gate figure for a full life-cycle figure.
2. Collecting Activity Data: From Submetering to Shared-Build Allocation
Activity data fall into three categories. The first is measurable direct data: for the build stage, use machine-level submeters to record total kWh; submeter auxiliary equipment such as chillers, compressors, dust collectors, and powder sieves, or calculate their consumption from power rating × operating time; record shielding gas in m³ per build using cumulative flowmeters; and calculate net powder consumption as issued powder less recovered and sieved powder, recording lot numbers and reuse cycles. The second is geometry and process data: export scan time, number of layers, layer thickness, part volume, support volume, and occupied plate area from the parameter package. These are the numerators for allocation. The third is quality-result data: accepted-part quantity, scrap quantity, reworked-part quantity, and witness-coupon quantity from inspection-batch records.
The most frequent accounting error in 3D printing is shared-build allocation. Equal allocation by part count is the crudest approach: a build plate may contain large thin-walled parts and small solid parts whose scan times and occupied build volumes differ by multiples. A weighted allocation factor is recommended, for example: w = 0.5 × occupied plate-area ratio + 0.3 × (volume × layer count) ratio + 0.2 × scan-time ratio. The weighting coefficients should be documented in the accounting procedure and, once established, must not be adjusted on a job-by-job basis. Shared consumption—such as preheating, recoater travel without exposure, atmosphere purging, build plates, and witness coupons—should first enter a common build pool and then be allocated to each part according to w. Consumption that can be directly attributed, such as additional remelting or a second machine run for a specific part, should be assigned directly to that part. Allocation rules affect results more than factor precision; freeze the rules before discussing factors.
3. Emission Factors and Data Quality Ratings: Do Not Report Primary Data and Default Values as if They Were the Same
Emissions are calculated by multiplying activity data by emission factors. Use a regional grid emission factor for electricity (an illustrative range is approximately 0.5–0.6 kgCO2e/kWh; in practice, use a customer-approved factor database and state its version year and geographic basis); use upstream factors or supplier product-carbon declarations for shielding gas, powder, resin, and packaging materials; and use t·km factors for transportation. Record five metadata items for every factor: source organization, database version and year, geographic applicability, technological representativeness, and unit-conversion coefficient.
More importantly, assign a Data Quality Indicator (DQI) rating to every data item. Assess technical representativeness, geographic representativeness, temporal representativeness, completeness, and verifiability on a 1–5 scale, then use an average or weighted score. Machine submeter readings with calibration certificates and corresponding timestamps may be rated 1–2; industry averages or database default values may be rated 4–5. The declaration must disclose the share of high-emission-contribution items with DQI ≥4. Using default factors is not shameful; presenting default factors as measured data is—this is among the first items a verifier will examine.
4. Four Additive-Specific Amplification Factors: Omitting Them Creates Systematic Underestimation
The first is supports and build plates: support material must be included in the raw-material stage, and removed support scrap must also be included if it is not recovered. Support reductions achieved through overhang-angle optimization should appear as a lower value under the same functional unit. The second is witness coupons and test specimens: they consume material and machine time but are not delivered as accepted parts, so they must be allocated through the common pool to accepted parts or reported separately as “emissions for quality validation per batch.” The third is scrap and rework: apply a yield amplification factor, meaning accepted-part carbon intensity = total emissions within the boundary ÷ number of accepted delivered parts, rather than dividing by the number of parts started. Reprints resulting from first-build failures can substantially increase the per-part result for that batch; retain batch-to-batch variation in the calculation rather than smoothing it away with an annual average. The fourth is post-processing and the three waste streams: heat-treatment furnaces, CNC machining, blasting, cleaning, dust collection, and hazardous-waste disposal all have separate energy and material flows, which are often broadly absorbed into “manufacturing overhead” and omitted.
These four items share a common feature: they are “nonconforming or auxiliary” elements, precisely the fields missing from generic manufacturing carbon-accounting templates. The accounting procedure should include a mandatory field for each. Even a zero value must be accompanied by a stated reason.
5. Uncertainty, Evidence Trail, and Declaration Boundaries
A single-point figure is insufficient for an external declaration. At minimum, provide an uncertainty interval: assign relative uncertainties separately to activity data and factors—for example, ±2% for meters and ±5%–15% for factors—then use error propagation or Monte Carlo sampling for high-contribution items to report P50 and P95, stating whether the declaration uses a conservative upper bound or a median value. Sensitivity analysis should identify the top three carbon hotspots, typically build-stage electricity, upstream powder production, shielding gas, or heat treatment.
Organize the evidence trail according to ALCOA+ principles, with at least eight items: submeter calibration certificate number and validity period; factor-database version screenshot or reference; parameter-package version and build-report number; powder lot number and weighing records; scrap and rework log; allocation-rule version number and weighting coefficients; accepted-part list for the inspection batch; and accountant, reviewer, and timestamps. A carbon figure is verifiable only when a third party can trace it from a summary table back to an original record. The declaration boundary should also state that the result is factory-gate scope, excludes the use phase and capital-equipment manufacturing, and requires reissue when allocation rules or factor versions change, while retaining historical versions.
6. Feed Carbon Results Back into Process Decisions Rather Than Producing Only a Report
The value of accounting lies in the closed loop. Under the same functional unit, four types of quantitative comparisons can be made: differences in support volume and scan time resulting from alternative nesting layouts and build orientations; shared-build combination optimization, such as grouping parts with similar scan times to reduce common-pool allocation; substitution of post-processing routes, such as using heat-treatment-free materials or near-net-shape production to reduce machining; and the carbon cost of powder reuse-cycle limits versus scrap and reprinting. Each decision should be evaluated simultaneously using carbon intensity per accepted delivered part + yield + lead time, avoiding reductions in carbon emissions that sacrifice reliability or on-time delivery. When customers set carbon-reduction targets, presenting the difference between a baseline and improved version under the same functional unit is more persuasive than applying an isolated green label.
Summary: Eight-Item Minimum Checklist
① Tie the functional unit to accepted delivery and state the condition and technical-agreement version; ② segment the system boundary and state inclusion/exclusion rationale for every stage; ③ classify activity data as direct measurement, geometry/process, and quality-result data; ④ freeze and version-control shared-build allocation rules; ⑤ provide every factor with five metadata items: source, version, geography, representativeness, and conversion coefficient; ⑥ assign every data item a DQI rating and disclose the share of high-contribution default values; ⑦ make supports, witness coupons, scrap/rework, and post-processing waste streams mandatory entries; and ⑧ provide an uncertainty interval, carbon hotspots, and indexes to eight original records. Carbon accounting deserves inclusion in delivery documentation only when it can be tied to “one functional unit, one allocation rule, one factor version number, and one certificate number.” This is the natural extension of connecting blueprints, process parameters, and physical delivery into one verifiable data chain.
Invia un modello, un disegno, un'immagine o note scritte. Gli ingegneri valuteranno materiale, processo, finitura e consegna in base all'uso effettivo.