
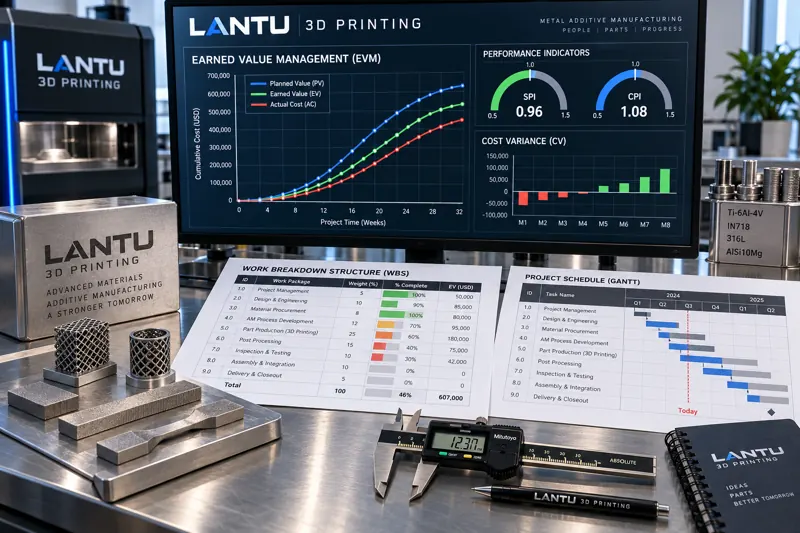
Introduction: The Project Is Reported as 80% Complete—Why Is Delivery Still Out of Control?
In service-based 3D printing projects, one of the most dangerous statements is: “This order is roughly 80% complete.” The actual status of a metal printing order is far from linear. An aerospace bracket may have completed 1,200 layers of powder-bed fusion and appear to be more than halfway finished. However, if thermal-stress-induced distortion triggers a shutdown at layer 1,400, the remaining work is not merely “20%”; it is an entire cycle of reorientation, redesigning supports, and reprinting. Project costs behave similarly: 60% of machine time may already have been consumed, while the major cost items—powder, process gas, and outsourced post-processing—often occur primarily in the latter half of the project. Describing project status by intuition or by the proportion of process steps completed is the common starting point for both schedule delays and cost overruns.
Earned Value Management (EVM) provides a method for quantifying both schedule and cost within the same framework. It is not merely a reporting tool in financial software, but a minimum measurement system that can be implemented at the shop-floor level. As long as three figures can be established—Planned Value (PV), Earned Value (EV), and Actual Cost (AC)—it is possible to derive the Schedule Performance Index (SPI), Cost Performance Index (CPI), Estimate at Completion (EAC), and Estimate to Complete (ETC). This article outlines an engineering-oriented implementation path for applying this system to 3D printing projects.
I. Three Baseline Metrics: Defining PV, EV, and AC in the Print Shop
All EVM calculations are based on three observed values. If these definitions are incorrect, every subsequent index becomes noise.
Planned Value (PV): the budgeted value of work that should have been completed by the reporting date according to the baseline plan. In 3D printing projects, PV should not be distributed evenly by calendar day. Instead, it should be weighted by work package. A typical metal order can be divided into six work packages: data validation and build layout (10% weight), support design and process parameters (10%), printing (35%), heat treatment and support removal (15%), machining and inspection (20%), and surface finishing and packaging (10%). These weights should be based on the actual labor-hour and outsourced-cost distribution of historical work orders, rather than subjective estimates.
Earned Value (EV): the budgeted value corresponding to work actually completed by the reporting date. This is the area most prone to error: EV must represent the “budget for completed work,” not “money already spent,” nor “number of layers printed.” If the printing stage uses layer completion as a measure, it must be combined with quality gates. A build that has not completed in-process melt-pool monitoring review or first-layer and critical-layer slice verification must not recognize EV according to its physical progress. It may only receive a fixed “work-in-process verification percentage” (recommended to be no more than 50% of that work package).
Actual Cost (AC): the costs actually incurred by the reporting date. For 3D printing, the AC accounting basis must explicitly include four categories: equipment depreciation and machine time (machine-hour rate × actual occupied machine hours), materials and gases (actual powder consumption × unit price, with argon/nitrogen based on cumulative flow-meter readings), outsourcing and inspection (heat treatment, machining, CMM/CT recorded upon invoice receipt or report completion), and rework and scrap (recorded separately for traceability). Inconsistent accounting rules are the primary reason for erratic CPI results. It is recommended that these rules be formalized in an AC collection specification and signed off at project launch.
II. Deriving Performance Indicators from the Three Metrics: SV, CV, SPI, and CPI
Once PV, EV, and AC are available, four indicators can be calculated:
Schedule Variance: SV = EV − PV; Cost Variance: CV = EV − AC.
Schedule Performance Index: SPI = EV / PV; Cost Performance Index: CPI = EV / AC.
Indexes are more stable in engineering terms than variances because they eliminate differences in project scale. As a practical guideline, a SPI or CPI below 0.9 should trigger a written root-cause analysis, while a value below 0.8 should trigger management intervention. Conversely, a CPI consistently above 1.15 is usually not evidence of exceptional performance; it often indicates an overstated budget baseline or omitted AC items, most commonly gases and scrap. The accounting basis should be reviewed rather than celebrated.
The combination of the two indexes also carries different meanings. Low SPI with normal CPI indicates a capacity or scheduling issue, such as machine time being consumed by rush orders or queues in post-processing. Normal SPI with low CPI indicates process yield problems or increases in outsourcing prices. When both are low, the underlying approach has usually been underestimated, and the issue should be escalated back to quotation and technical review.
III. Forecasting: Using EAC and ETC to Calculate Overruns in Advance
The real value of EVM is not retrospective evaluation, but estimate at completion. Three basic methods are available:
1) Extrapolation based on current cost performance: EAC = BAC / CPI, where BAC is the Budget at Completion. This assumes that current cost efficiency will continue through project completion and is suitable when the project has moved beyond the early ramp-up stage and the process is stable.
2) Considering both schedule and cost performance: EAC = AC + (BAC − EV) / (CPI × SPI). When schedule pressure requires overtime, expedited outsourcing, or air freight, this version is closer to reality—schedule acceleration itself increases cost.
3) Re-estimating the remaining work: EAC = AC + bottom-up re-estimated ETC. This method applies when major changes have invalidated the baseline, such as changing material from 316L to Inconel 718 or adding a HIP process. Under such circumstances, extrapolation using any index is meaningless, and work-package weights must be re-established.
Estimate to Complete is calculated as ETC = EAC − AC. For 3D printing orders, ETC is the primary basis for quotation changes and customer communication. When ETC exceeds the remaining amount of the original contract by 10%, commercial discussions should be initiated rather than silently absorbing the cost.
IV. Implementation: The Minimum Changes Needed to Embed EVM into Existing Work Orders
A complete EVM system involves WBS development, baseline change control, and organization-level processes, which can be excessive for most additive manufacturing shops. A minimum implementation can follow the steps below:
Step 1: Structure quotations by work package. Change quotations from a single total price to a budget distribution across six work packages. This simultaneously establishes the basis for price validation and the EVM baseline, or BAC.
Step 2: Define completion criteria for every work package. The criteria must not be “work started” or “nearly finished,” but verifiable deliverables. For example: build layout complete = the print job has been released and the simulation report archived; printing complete = the build has been removed from the machine and melt-pool monitoring has generated no abnormal alarms; inspection complete = the CMM report has been issued and the result is accepted. EV can only be credible when the criteria are verifiable.
Step 3: Establish a fixed review cycle. For orders with less than 40 machine hours, conduct reviews once per week. For orders exceeding 40 machine hours or spanning multiple months, trigger reviews weekly and upon completion of each work package. The review date is the sampling point for PV, EV, and AC.
Step 4: Track index trends rather than isolated data points. Fluctuation in a single SPI may result from rework in one batch; a downward trend over three consecutive periods is the real signal. SPI and CPI should be plotted as trend lines and reviewed alongside rework rate and equipment availability. When all three deteriorate simultaneously, the problem is typically process-related; when only SPI deteriorates, the problem is usually scheduling-related.
Step 5: Link warning thresholds to actions. Thresholds without associated actions are merely numbers: CPI<0.9 → the process engineer submits a variance analysis; SPI<0.9 for two consecutive weeks → the planner reschedules work and notifies the customer; EAC exceeds BAC by 10% → the commercial team initiates a change request. Only when actions are linked can the warning process form a closed loop.
V. Common Misconceptions and Boundaries
EVM is not suitable for very short prototyping orders lasting less than one week, where the cost of sampling exceeds the benefit. It is also unsuitable for exploratory R&D projects, because work-package weights cannot be determined in advance. Its appropriate application range is service orders with clearly defined deliverables, durations of two weeks to six months, and traceable costs—precisely the category that requires stronger management as 3D printing evolves from small-batch production toward volume supply.
Another misconception is treating EVM as a performance appraisal tool. Once SPI and CPI are directly linked to individual or team performance, EV reporting becomes systematically optimistic, and “80% complete” returns in a more precise-looking form. The proper use is to treat EVM as a common language for project status: customers, planners, process engineers, and commercial teams all review the same figures, shifting the discussion from “how much has actually been completed?” to “how do we recover from here?”
Conclusion
Earned Value Management moves 3D printing projects from a state in which “schedule is determined by asking and cost by estimating” to one in which both can be discussed using measurable data. The minimum implementation path is: structure quotations by work package to establish BAC, define EV through verifiable criteria, consolidate AC using a consistent accounting basis, calculate SPI/CPI weekly and forecast EAC, then link every threshold to a specific action. For full-lifecycle delivery platforms such as lantu3D, this measurement system is not a report prepared for customers; it is the foundational method for truly connecting design, printing, post-processing, inspection, and delivery into a measurable chain. Only when every link can be quantified can delivery commitments and cost commitments have a reliable basis for fulfillment.
Invia un modello, un disegno, un'immagine o note scritte. Gli ingegneri valuteranno materiale, processo, finitura e consegna in base all'uso effettivo.