
Introduction: Electricity, Gas, and Carbon Are Accounted For—Why Is Water Still on the Main Meter?
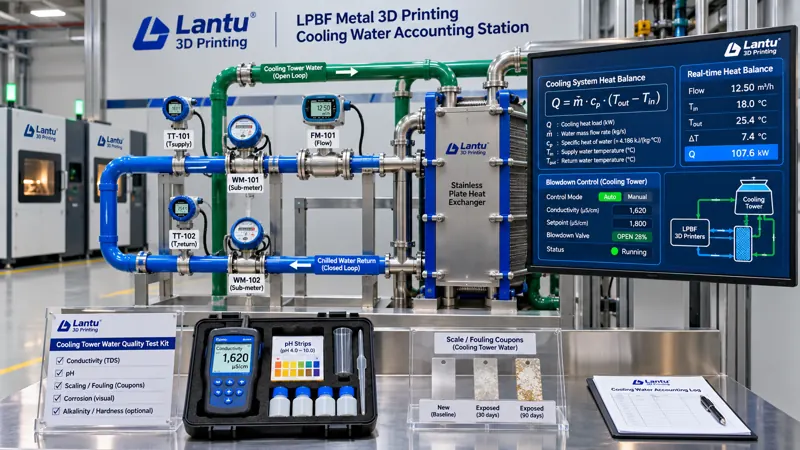
Over the past two years, lantu3D has progressively refined its workshop energy management: peak/off-peak tariffs and demand charges are reconciled against electricity bills; inert-gas oxygen content and per-part gas consumption are tracked in m³/part; and carbon footprints are reported in kgCO₂e per conforming delivered part. Yet one utility has rarely been accounted for separately: cooling water. The lasers, galvanometer scanners, build-chamber jackets, vacuum pumps, air compressors, dehumidifiers, and post-processing annealing furnaces used in metal LPBF systems all rely on circulating water to remove heat. A single machine commonly operates with cooling-loop flow rates of 8–15 L/min, inlet-to-outlet temperature differences of 3–6 °C, and a supply-water requirement of 20±2 °C. In most plants, only one building-level water meter is installed, with makeup water mixed with fire-protection and domestic consumption; cooling-tower blowdown valves are opened based on experience; and heat-transfer performance declines gradually as scale accumulates, until laser output fluctuates, chamber-temperature alarms occur, or vacuum-pump discharge temperatures rise and force an unplanned shutdown.
The common issue is not a lack of water, but a lack of auditable engineering data for water. This article does not offer water-saving slogans. It provides an accounting method that can be implemented through submeter readings, heat-balance equations, cycles-of-concentration criteria, per-part water-consumption metrics, and release records—placing water on the same energy ledger as electricity, gas, and carbon.
1. Define the Boundary First: Four Heat Loads and Three Water Circuits
The first step in accounting is not meter installation, but clear system-boundary definition. Workshop cooling water typically serves four categories of loads: optical and laser loads (laser sources, galvanometer scanners, and protective-window mounts, which are most sensitive to water temperature and quality); build-chamber loads (build-cylinder jackets, build-plate preheating loops, and atmosphere-circulation heat exchangers); auxiliary power loads (vacuum pumps, air-compressor aftercoolers, and chiller condensers); and post-processing loads (annealing furnaces and temperature-controlled washing tanks). The thermal-load profiles of these four categories do not coincide: laser loads fluctuate with scanning duty cycle; build-chamber loads plateau during preheating and recoating; auxiliary loads are nearly continuous; and post-processing loads are intermittent by furnace cycle. When all are combined in one main pipe, no ΔT reading can be meaningfully attributed.
The water system should therefore be divided into three separately metered circuits: primary side (heat-rejection loop for the cooling tower or outdoor unit); secondary side (equipment-side closed loop, typically using deionized water or glycol solution); and makeup water and blowdown (municipal-water makeup, concentration blowdown, and overflow losses). Water volume in the closed secondary loop remains essentially constant. Actual consumption occurs through primary-side evaporation and blowdown, together with makeup water. Therefore, the numerator for per-part water consumption may only use makeup-water volume, not circulating-pump flow. Once the boundary is documented in a Water System and Metering Point Map and each point is assigned an ID—such as W-01 makeup meter, W-02 blowdown meter, T-01/T-02 secondary-side inlet/outlet temperatures, and F-01 secondary-side flow—all subsequent disputes can be resolved against the same map.
2. Submetering and Heat Balance: From Readings to Reproducible Q
Heat removed by the secondary side is calculated as Q = c·m·ΔT, where the specific heat of water c is 4.18 kJ/(kg·°C), and mass flow rate m is converted from F-01. For example, for a 500 W-class LPBF machine with a secondary-side flow of 12 L/min (0.2 kg/s) and an inlet-to-outlet temperature difference of 4.5 °C, Q ≈ 4.18 × 0.2 × 4.5 ≈ 3.76 kW. This should reconcile with the combined heat from laser electrical power and electro-optical conversion losses, galvanometer losses, and chamber heat dissipation. If the deviation exceeds ±20%, first suspect flowmeter drift or temperature sensors that have not been calibrated as a pair. The critical discipline is paired temperature measurement: installing only one outlet thermometer while using the setpoint as the inlet temperature turns ΔT into a fixed value and makes the heat balance meaningless.
For the primary side, use makeup water W_make-up, blowdown W_blowdown, and evaporation W_evap to establish a water balance: W_make-up = W_evap + W_blowdown + W_drift (drift and leakage). Only makeup and blowdown meters can be read directly. Evaporation can be back-calculated from the heat balance as W_evap ≈ Q_total / (r + c·Δt), where r is latent heat of vaporization at approximately 2400 kJ/kg and Δt is the cooling-tower inlet-to-outlet temperature difference. This enables closure of the three terms even without an evaporation meter. A persistent closure error of >8% indicates leakage or inaccurate instrumentation—not simply that hot weather required more makeup water.
3. Cycles of Concentration and Blowdown: Recirculating Water Cannot Be Makeup-Only
An open cooling tower evaporates pure water while leaving dissolved salts in the system. The cycle of concentration N = makeup-water ion concentration / circulating-water ion concentration, commonly approximated in the field by the conductivity ratio. If N is too low, excessive blowdown wastes water and treatment chemicals. If N is too high, calcium carbonate precipitates, heat-transfer surfaces scale, and corrosion rates rise. An engineering control range of N = 3–5 is common, corresponding to blowdown of approximately 1/(N−1) of evaporation; at N=4, W_blowdown ≈ W_evap/3. Criteria must be written as measurable limits rather than as “good water quality”: circulating-water conductivity ≤1500 μS/cm, total hardness ≤200 mg/L as CaCO₃, pH 7.5–9.0, and turbidity ≤10 NTU. Samples should be taken weekly, with chemical-treatment batch numbers and dosing quantities recorded. If conductivity exceeds the limit on two consecutive measurements, blowdown and retesting are mandatory. Simply increasing makeup water for dilution is not acceptable—it only masks N without reducing the total salt load.
The closed secondary loop requires separate criteria: deionized-water conductivity should be ≤50 μS/cm; glycol concentration should be adjusted to frost-protection requirements and reviewed quarterly; and pH and corrosion-inhibitor concentration should follow the equipment manufacturer’s water-quality specification. A 5–20 μm filter with a differential-pressure gauge is recommended for optical-load loops. Replace the filter element when differential pressure exceeds 1.5 times its initial value. Protective windows and laser flow channels are highly sensitive to particles, and the cost of one failed filter is far greater than the cost of the filter element itself.
4. Scaling and Heat-Transfer Degradation: Converting ΔT Pinch into a COP Criterion
The greatest danger of scaling is that it does not trigger an alarm. As thermal resistance on heat-transfer surfaces slowly rises, secondary-side ΔT decreases and equipment inlet-water temperature increases. The control system automatically raises cooling-tower fan or chiller-compressor load to maintain the setpoint. As a result, water temperature appears normal while electricity consumption quietly rises. Therefore, criteria cannot focus only on temperature; they must address temperature approach and energy efficiency. The approach temperature between primary-side outlet water and secondary-side inlet water of a plate heat exchanger should be ≤2 °C. Chiller COP, defined as cooling capacity divided by compressor input power, should use the same-condition value from the first month of operation as its baseline. A decline of >15% triggers chemical cleaning and retesting; a decline of >25% requires shutdown, inspection, and assessment for heat-exchanger core replacement.
Water-system events must also be linked to build quality. Every supply-water temperature excursion and every heat-transfer-efficiency anomaly must record the corresponding build layer number, machine position, and scan-job ID. The oxygen content, melt-pool monitoring data, and witness-specimen results for parts in that chamber should then be reviewed. This follows the same logic as binding millisecond-level voltage sags to build layers in power-quality management: a utility disturbance can support a release decision only when it is linked to a specific part. A three-level decision framework is recommended: Level A, where water temperature, flow, and quality are all within limits, permits normal release; Level B, involving an excursion of ≤5 minutes with conforming witness specimens from the same chamber, permits release after review and deviation recording; Level C, involving an excursion of >5 minutes, COP degradation of >25%, or an untreated conductivity exceedance, requires isolation of parts from that chamber and disposition according to inspection-lot retest rules.
5. Per-Part Water Consumption: Conforming Delivered-Part Basis and Shared-Build Allocation
The accounting basis should align with gas-consumption and carbon-footprint metrics: per-part water consumption = (makeup-water volume during the accounting period − non-production water volume) ÷ number of conforming delivered parts during the accounting period. Non-production water—including domestic use, fire protection, floor washing, and landscaping—must be separately metered and deducted from the numerator. Otherwise, monthly headcount variation will distort the metric. The denominator must be the number of parts that pass inspection, complete required post-processing and packaging, and are delivered to the factory gate—not the number of printed parts. Water consumed by scrap and rework should properly be amplified into the conforming-part result through yield. This is precisely why the metric offers more decision value than total water cost divided by total part count.
For shared builds, allocation should use a thermal-load proxy rather than an equal split by part count. Construct a weighting factor w from each part’s scanning time × layer count × support and build-plate volume correction factor. Allocate the common pool—preheating, atmosphere purging, build-plate cooling, witness-specimen cooling, and standby baseline water—according to w. Directly attributable consumption, such as water used by a dedicated post-processing washing tank for a specific part, should be assigned directly to that part. The weighting formula must be frozen before the accounting period begins and entered under a version number in the Water-Consumption Allocation Rules. Retrospectively selecting weights based on results is prohibited. Freezing rules before discussing factors is a fundamental principle shared by energy and carbon accounting. Three metrics should be reported together: average water consumption per part, P50/P95 by part family, and the contribution of water consumption, electricity cost, and gas consumption to unit-part energy cost. This prevents local optimization such as saving 3 m³ of water while consuming an additional 400 kWh of electricity.
6. Evidence Chain and Implementation: ALCOA+ and an Eight-Item Checklist
All readings must be reproducible by a third party. Records should therefore follow ALCOA+: attributable (measurement-point ID, instrument ID, and calibration validity); legible (original readings rather than manually transcribed summaries); contemporaneous (using the same time source as build timestamps, with no post-event backfilling); original (retaining raw water-meter pulse records and temperature-curve files); and accurate (recording corrected values in a compensation table with dual-person review), supplemented by completeness, consistency, endurance, and availability. Each record must include at minimum: timestamp; cumulative W-01/W-02 readings; instantaneous T-01/T-02 values; F-01 flow; conductivity and pH; associated build ID and layer number; decision level; responsible person; and reviewer. Instruments should be calibrated annually, temperatures calibrated as pairs, and flowmeters compared using portable ultrasonic instruments. Calibration certificate numbers must be entered into the ledger.
A 30-day implementation plan can be divided into five steps: in Week 1, draw the metering-point map and install W-01/W-02 and paired temperature measurements; in Week 2, run water-balance closure calculations and establish the cycles-of-concentration control range; in Week 3, establish the COP baseline and three-level release criteria; in Week 4, freeze allocation rules and trial-calculate per-part water consumption for three part families; and in Week 5, incorporate water consumption into the monthly energy ledger for joint review with electricity costs, gas consumption, and carbon intensity. Finally, conduct a self-audit using an eight-item checklist: complete metering map and measurement-point IDs / separate metering for makeup and blowdown / paired temperature calibration / water-balance closure error ≤8% / conductivity and hardness limits with weekly records / baseline and corrective triggers for approach temperature and COP / exceedance events linked to build layers with three-state disposition / version-controlled allocation rules with conforming delivered parts as the denominator.
Conclusion
Cooling water is not simply “a pipe attached to the machine”; it is a fourth accountable utility alongside electricity, gas, and carbon. Managing it does not begin with replacing a chiller with a larger unit, but with four concrete elements: a numbered water-system and metering-point map, a water-balance equation that closes, numerical criteria for water quality and heat-transfer degradation, and a per-part water-consumption metric based on conforming delivered parts and linked to builds. With these four elements in place, abnormal water temperatures are no longer discovered only after shutdown, and water conservation is no longer a slogan. It becomes engineering data that can enter quotations and cost calculations and be verified by customers and third parties. For a platform such as lantu3D, which manages work from blueprint and design through physical delivery, the verifiability of utility data is itself part of delivery capability.
Invia un modello, un disegno, un'immagine o note scritte. Gli ingegneri valuteranno materiale, processo, finitura e consegna in base all'uso effettivo.