
Introduction: Why a Single Outage Can Cause an Entire Batch of Orders to Miss Their Commitments
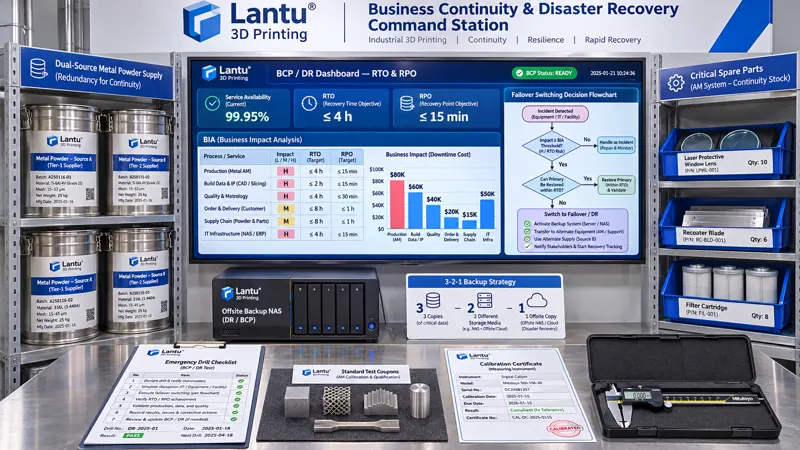
The delivery chain in a metal 3D printing shop is highly coupled: a laser module failure on an LPBF machine, a delayed shipment of PA12 powder, or confusion over process parameter file versions can cause more than ten orders promised for the same week to slip simultaneously. Many companies already have contingency plans—contacting the equipment supplier when a machine fails or adding shifts to expedite urgent orders—but these plans answer "who to contact after an incident." They do not answer "how quickly must recovery occur, what state must be restored, and which orders should be protected first if recovery is not possible." Business continuity management (BCM), drawing on the ISO 22301 framework, fills this gap: it breaks delivery capability into interruptible units, quantifies the cost of disruption through business impact analysis (BIA), works backward from recovery time objectives (RTOs) and recovery point objectives (RPOs) to determine redundancy investments, and verifies through drills that switching can actually be completed within the target time. It is not an appendix to a risk register, but a set of measurable, auditable, and verifiable engineering controls.
1. BIA: Breaking Down the Delivery Process into Interruptible Units and Quantifying Disruption Costs
The first step in a BIA is not to list risks, but to list delivery functions. It is recommended to break the process into six stages: model receipt and process review; powder/resin preparation; printing and forming; support removal and post-processing; inspection and release; and packaging and shipment. For each stage, record three fields: the time after interruption at which unacceptable impacts begin to occur, or maximum tolerable downtime (MTD); upstream dependencies, such as machine model, material batch, tooling, parameter files, and inspection equipment; and direct losses after 1 hour, 4 hours, and 24 hours of interruption, including rework labor, contractual penalties, expedited freight, and customer production-line shutdown claims. For example, the MTD for the printing stage is often set at 8–24 hours, while the MTD for inspection release may be only 4 hours if it relies on a single CMM, because blocked release holds all completed parts in place. Plotting the MTD and loss curve for every stage in one table naturally reveals recovery priorities: restore the bottleneck stage first, rather than repairing the most expensive machine first. The output of this step is a numbered function list and classification table. Every subsequent redundancy investment must be traceable to the MTD of a specific line item, preventing situations in which spare parts are purchased but critical nodes remain unprotected.
2. RTO/RPO: Converting Customer Commitments into Verifiable Recovery Metrics
An RTO is the latest acceptable time by which a function must be restored, while an RPO is the acceptable window of data loss. Both must be shorter than the MTD of the corresponding functional stage and include a buffer. A three-tier approach by order category is recommended: Category A (risk of customer production-line shutdown and contracts containing penalty clauses), RTO ≤4 hours and RPO ≤15 minutes; Category B (standard production parts), RTO ≤24 hours and RPO ≤4 hours; and Category C (prototypes and parts that are not schedule-sensitive), RTO ≤72 hours and RPO ≤24 hours. Metrics must be written in verifiable terms, such as: "The print parameter package and latest calibration record for a Category A order can be rolled back at any time to a version no more than 15 minutes old," rather than "data loss should be minimized." The RPO determines backup frequency and audit-trail granularity. A 15-minute RPO requires process parameters, machine logs, and inspection records to have timestamps and incremental snapshots; a manual copy at the end of each workday is insufficient. A 4-hour RPO can use scheduled archiving with change orders, while a 24-hour RPO can rely on daily off-site backups. The acceptance criteria should also include status confirmation after recovery: after equipment restoration, a standard test artifact must be used to verify geometric accuracy and energy-density-related conditions, including positioning accuracy, measured laser power, and oxygen level, with evidence retained. A machine that starts running again does not necessarily mean that the function has been restored.
3. Redundancy Design: Three Switching Paths for Supply Interruptions, Equipment Outages, and Outsourcing Failures
Only after BIA and RTOs have been established does redundancy have a sound basis for deployment. Three paths correspond to three categories of single points of failure. Material supply interruption: establish dual sources for metal powders and engineering plastics used in Category A orders. Dual sourcing does not simply mean finding a second supplier; it requires the D50 particle-size distribution, Hall flow rate, apparent density, and oxygen content of both powder batches to fall within the same process window. Blend ratios and first-article validation must be completed in advance to create a "switchable batch list." Maintain safety stock for critical grades based on MTD, for example, sufficient to cover a 4-hour RTO plus one replenishment lead time. Equipment outage: identify wear parts with the greatest downtime impact, such as protective lenses, recoater blades, filter elements, seals, and vacuum pump oil, and set minimum spare quantities based on MTBF and procurement lead time. At the same time, register qualified external capacity using the same process, clearly defining the partner's machine models, printable materials, inspection capabilities, and confidentiality boundaries, turning "finding a supplier at short notice" into "validated backup capacity." Outsourcing/system failure: use 3-2-1 backups for model files, process cards, and inspection reports—three copies, on two media types, with one copy off-site—and prepare offline delivery packages for Category A orders so production can continue using controlled versions even if the MES or file server is unavailable. Each path must define trigger conditions, decision-makers, switching action checklists, and switchback conditions. Switching costs, including requalification labor, material loss, and freight, should be calculated in advance and used as inputs to the BIA loss curve rather than becoming post-incident surprises.
4. Data and File Recoverability: Version Control Is a Prerequisite for Continuity
The most common failure during recovery drills is not that equipment cannot be restarted, but that "it has been restored but cannot be used with confidence": the parameter package version is unclear, calibration certificates have expired, or inspection records cannot be matched to physical batches. Continuity must therefore be built on version control. Each delivery unit should be linked to four controlled objects: the 3D model, including version number and hash; the process parameter package, including frozen values for laser power, scan speed, layer thickness, and hatch overlap; equipment-status evidence, including the most recent calibration or interim verification record; and inspection release records. Backup objects must include metadata, not only the files themselves: who changed which field and when, which change order it corresponds to, and whether superseded versions have been marked. For Category A orders, generate an immutable snapshot after every critical change. During recovery, verify in four steps: model hash, parameter package version, calibration validity, and inspection records. If any step fails, the batch is deemed not restored and release is prohibited. This elevates RPO from "the file was not lost" to "recovery has reached a verifiable, releasable state" and is often the area most closely examined in audits and customer second-party assessments.
5. Recovery Drills: Three Levels of Validation from Tabletop Exercises to Actual Switching
A BCP without drills is only a document. A three-level progression is recommended. Tabletop exercises (quarterly): personnel in each role verbally walk through actions and elapsed time for disruption scenarios, checking whether the RTO is achievable and whether there are gaps in the decision chain. Component switching drills (semiannually): actually conduct one first-article validation using blended dual-source powder, one standard test artifact verification after spare-part replacement, and one restoration of a parameter package from an off-site backup followed by hash comparison; record actual duration and deviations. End-to-end drills (annually): simulate an outage in the forming stage, switch a Category A order to backup equipment or validated external capacity, and complete the full closed loop from switching decision, material and file transfer, and first-article release to customer notification. Each drill should produce four quantified results: actual recovery time, actual data-loss window, scrap and rework labor caused by switching, and ownership and corrective-action deadlines for nonconformities. Drill acceptance criteria must be strict: if actual recovery time exceeds the RTO, the drill fails; it must not be closed ambiguously as "basically restored." Nonconformities must enter CAPA and trigger another drill, creating a closed loop of "set targets—verify—correct—re-verify."
6. Performance Dashboards and Continual Improvement
Continuity management requires a small set of indicators that can be tracked over time: drill pass rate (number of successful drills divided by total drills, target ≥90%); mean time to recovery (MTTR), broken down by interruption type; spare-parts availability rate (actual inventory of critical spares divided by the defined minimum inventory); dual-source switchable-batch coverage (backup batches with completed process validation divided by material grades used for Category A orders); and backup restoration success rate (the percentage passing hash and metadata verification on the first attempt). These indicators should share the same numbering system as quality-system CAPA records, equipment-management MTBF logs, and warehouse safety-stock data, avoiding separate and disconnected spreadsheets. Every six months, use actual disruption events and drill deviations to revise the BIA's MTDs and loss curves. As the business mix changes and customer production cadence changes, recovery priorities should change accordingly. By including these items in management review inputs, business continuity will not remain a last-minute documentation exercise before a certification audit.
Conclusion
The vulnerability of 3D printing delivery arises from chain coupling, not from the unreliability of any single machine. A practical sequence is to first use BIA to break delivery into interruptible units and quantify MTDs and losses; then use RTO/RPO targets to translate customer commitments into verifiable recovery metrics; next deploy dual sourcing, spares, backup capacity, and 3-2-1 backups according to those metrics; and finally use three-tier drills to confirm that switching genuinely meets targets and that the recovered state is truly releasable. For integrated platforms such as lantu3D, which connect drawings and design through to physical delivery, the value of this approach is not merely reducing downtime. It makes "on-time delivery" an engineering capability supported by metrics and an evidence trail that customers and auditors can verify, rather than a promise dependent on improvised coordination.
Submit a model, drawing, image or written notes. Engineers will review material, process, finishing and delivery based on actual use.