
Introduction: Why Quality Control in 3D Printing Cannot Rely Solely on Final-Part Inspection
As metal and polymer additive manufacturing advances toward low-volume and volume production, many teams still rely on a familiar quality-inspection approach: once each build is complete and post-processing has finished, they sample finished parts for dimensional, visual, and mechanical inspection. Conforming parts are released, while nonconforming parts are reworked or scrapped. This approach may remain workable at production volumes of several dozen parts per month, but once output reaches hundreds of parts per week, with multiple machines running in parallel and multiple powder lots in use, three structural problems emerge.
First, inspection results arrive too late. When final-part inspection identifies a shift, dozens of parts may already share the same deviation, making traceability and sorting far more costly than in-process containment. Second, the criteria are too coarse. A binary pass/fail decision masks process-drift trends. A gradually deteriorating process may remain entirely within tolerance for multiple consecutive lots before suddenly crossing a limit. Third, accountability is difficult to establish. When defects occur, without process data archived by lot, machine, and powder batch, teams can only rely on experience-based assumptions and cannot create a reusable process-improvement loop.
The value of statistical process control (SPC) lies in moving quality control upstream, from final disposition to process monitoring. It does not replace first-article qualification or final-part inspection; instead, it establishes a continuous, quantifiable band of process stability between them, allowing shifts to be detected before they become nonconforming product.
1. The Prerequisite for SPC: Define What to Monitor
The most common reason SPC implementation fails is selecting the wrong monitoring targets. An additively manufactured part may contain dozens of dimensional features. If all of them are included in control charts, the cost of maintaining the data will quickly exceed the benefits. A sound approach starts with tiered screening based on key characteristics (KCs).
Key characteristics are typically identified through three lines of inquiry. The first is functional relevance: dimensions involved in assembly fits, sealing, load bearing, or motion, such as the diameter of a mating hole, flatness of a locating surface, or depth of a sealing groove. The second is process relevance: features with the greatest historical variation on a given machine, such as wall thickness in thin-walled parts, flatness of large planar surfaces, and angular deviation of overhanging surfaces. The third is failure relevance: features repeatedly associated with past customer complaints, rework, or scrap records.
After cross-screening these three categories, a typical part will generally retain only three to eight key characteristics. Each key characteristic should be clearly identified on the drawing or inspection sheet, along with its measurement method, gage resolution, and sampling frequency. One frequently overlooked constraint is that control-chart resolution depends on gage resolution. If a gage has a resolution of 0.01 mm while the process standard deviation of the measured feature is only 0.003 mm, the control chart will exhibit obvious step-like stratification and its ability to detect exceptions will be substantially reduced. Gage resolution should generally be no greater than one-tenth of process variation.
2. Control Chart Selection and Exception Rules
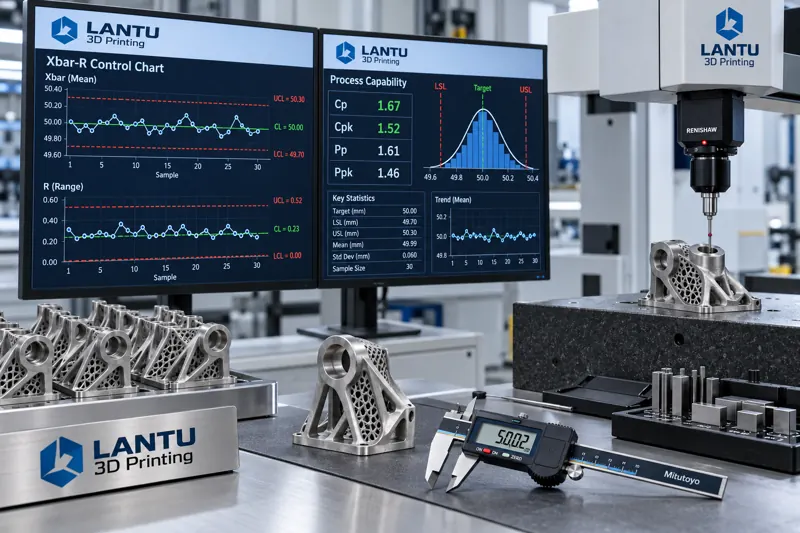
For variable-type key characteristics, the most commonly used chart is the Xbar-R control chart. At each sampling point, three to five parts are selected to form a subgroup, and the subgroup mean and range are calculated and plotted on separate charts. The mean chart monitors whether the process center has shifted, while the range chart monitors whether process variation has increased. Both charts should be interpreted together. If the range chart is out of control while the mean chart remains in control, variation has increased but the process center has not shifted; common causes include a powder-lot change, fluctuations in machine condition, or reduced operational consistency. If the mean chart is out of control while the range chart remains in control, a systematic shift has occurred; common causes include recoater-blade wear, optical-system contamination, or drift in build-plate leveling.
Control limits should be calculated from actual process data. Typically, at least 25 consecutive subgroups of stable data are used, with the upper and lower control limits estimated from the average subgroup mean plus or minus three standard deviations. It is important to emphasize that control limits and tolerance limits are entirely different concepts. Control limits describe what the process can actually achieve, while tolerance limits describe what the customer requires. The process capability index, Cpk, is the bridge between the two because its calculation considers both centering and dispersion. A common industry threshold is a Cpk of at least 1.33, corresponding to a theoretical proportion of approximately 99.99% within the tolerance band. For safety-related or high-value features, a requirement of 1.67 or higher is often applied.
In addition to the most basic rule of a single point outside a control limit, internationally recognized exception criteria include nine consecutive points on the same side of the centerline, six consecutive increasing or decreasing points, 14 consecutive alternating up-and-down points, and two of three consecutive points beyond two standard deviations on the same side of the centerline. These rules identify statistically unlikely patterns and are intended to capture non-random process changes before a limit is crossed. In additive manufacturing, six consecutive increasing points often indicate gradual process degradation, such as a slow decline in protective-window transmittance; nine consecutive points on one side of the centerline often indicate a change in process parameters or material lot.
3. Engineering Implementation of Sampling Design and Data Collection
Sampling design determines both control-chart sensitivity and maintenance cost. Samples within a subgroup should be produced, as far as possible, on the same machine, from the same lot, and at similar times so that within-subgroup variation reflects short-term random variation. Between subgroups, sampling should span potential variation sources such as shifts, powder lots, and machine-maintenance cycles so that between-subgroup variation can reveal special causes. This sampling principle directly corresponds to SPC theory: within-subgroup variation estimates random error, while differences between subgroups estimate traceable causes.
The data-collection stage is often underestimated. Manual transcription followed by spreadsheet entry may be feasible in low-volume production, but data delays and transcription errors significantly reduce the real-time value of control charts. A more robust approach is to connect measurements of key characteristics directly to data-acquisition terminals. Results from coordinate measuring machines, vision systems, laser scanning, and industrial CT should be automatically structured and stored in a database, indexed by part number, lot number, machine number, and powder-lot number. When a control chart signals an exception, the system can directly retrieve process-parameter records, environmental records, and machine-status records from the relevant time window, linking the signal with potential causes.
For teams not yet equipped for automated data collection, a practical compromise is to first implement SPC on the highest-value production line and for three key characteristics, using standardized inspection sheets and daily summary tables for manual maintenance. After validating the effectiveness of the approach, it can be expanded step by step. Treating SPC as a one-time, full-scale rollout often leads to abandonment within a few months because the data-maintenance burden becomes excessive.
4. Response Process After an Exception Signal
A control-chart exception signal is only the beginning; the response process is what truly determines SPC effectiveness. A complete response loop generally includes four steps. The first is to confirm that the signal is valid by ruling out gage abnormalities, data-entry errors, and sample-identification errors. The second is to define the scope by determining the affected lots, machines, and time window. If necessary, trace backward to the last in-control point and forward to the point at which corrective action took effect. The third is cause investigation, checking each of the six dimensions of people, machine, material, method, environment, and measurement, with priority given to changes that occurred most recently before the exception. The fourth is action and verification: after corrective action is taken, collect at least five new subgroups to confirm that the process has returned to control and update the process capability index.
All exception events, root-cause analyses, corrective actions, and verification results should be archived as searchable records. Their value lies in building an internal failure-mode library: when a similar exception recurs, investigation time can be reduced from hours to tens of minutes. This is also the interface between SPC and a knowledge-management system. Process data alone are neutral; only when combined with historical cases do they become engineering capability.
5. Common Pitfalls and Implementation Recommendations
The first common mistake is setting control limits directly equal to tolerance limits. This delays exception detection until nonconforming product has already been produced, eliminating SPC's early-warning function. The second is failing to update control limits over long periods. After process improvements, machine replacement, or changes in the material system, process capability may have changed. Old control limits may become either too loose to retain sensitivity or too strict, generating excessive false alarms. Control limits should be recalculated at least every six months or after any major process change. The third mistake is monitoring without improvement. If a control chart runs stably but Cpk remains around 1.0 for an extended period, the process is controlled but lacks adequate capability. At that point, the focus should shift to systematic process optimization rather than further tightening inspection.
For teams beginning SPC implementation, the recommended sequence is to select one production line and three key characteristics; complete gage-resolution verification and measurement-system analysis; collect more than 25 subgroups to establish initial control limits; introduce exception rules and a response process; evaluate false-alarm rates and containment effectiveness after two months of operation; and then decide whether to expand. The full cycle generally requires three to four months, with investment concentrated in measurement and data collection rather than in software tools themselves.
Conclusion
Statistical process control provides an engineering framework for volume 3D printing delivery, from key-characteristic identification and control-chart exception detection to closed-loop response. It does not change the process itself, but makes process condition observable, quantifiable, and predictable. For additive manufacturing companies, the true barrier to SPC is not statistical theory, but the reliability of the measurement system, the continuity of data collection, and the existence of a rigorously executed response process after an exception signal. When these three foundations are firmly established, quality control can shift from sorting nonconforming parts to preventing them, improving both delivery consistency and cost structure in volume production.
Submit a model, drawing, image or written notes. Engineers will review material, process, finishing and delivery based on actual use.