
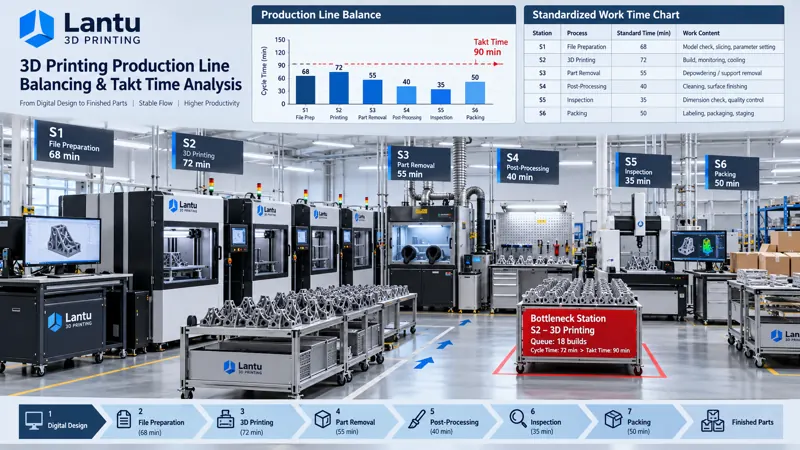
Introduction: Machines Are Busy, Yet Orders Are Still Late
In many 3D printing factories, a typical situation often occurs: printer utilization appears to be high, yet parts waiting for post-processing pile up in front of downstream workstations year-round. Depowdering, support removal, sandblasting, heat treatment, and inspection all form queues, while delivery dates keep slipping. Managers often attribute this to insufficient capacity and continue purchasing more equipment, only to find that work-in-process inventory keeps increasing while on-time delivery does not improve.
The root cause is usually not the speed of a single machine, but line balance. Additive manufacturing is a multi-step serial process consisting of printing, depowdering, support removal, post-processing, inspection, and packaging. The takt time of each step can vary dramatically: a laser powder bed fusion machine may run continuously for more than ten hours, while support removal and surface finishing for a complex part may take only tens of minutes. If tasks are allocated simply according to the number of machines, queues will inevitably form in front of slower processes. This article presents a practical engineering method for 3D printing workshops, covering standard time measurement, bottleneck identification, line balancing rate calculation, and takt optimization.
1. Why Takt Balancing Is Especially Difficult in 3D Printing Workshops
In traditional machining workshops, process takt times are relatively even. In additive manufacturing, however, takt distribution is highly uneven, mainly due to three factors.
First, process durations differ by orders of magnitude. For metal laser powder bed fusion (LPBF), a single build cycle often takes 8 to 30 hours, while depowdering and support removal for the same batch of parts may require only 1 to 3 hours. If labor and equipment are configured at a 1:1 ratio, the slower process will inevitably become the bottleneck.
Second, batch size is coupled with build nesting strategy. A single build can contain dozens of small parts or only one large part. Nesting density determines the printing time allocated to each part and also determines the arrival rhythm of downstream operations. Once the build strategy changes, the takt distribution of the entire line changes accordingly.
Third, post-processing time is highly dependent on part geometry. Within the same batch, parts with complex internal channels may require three to five times more time for depowdering and abrasive flow machining than simple external-shape parts. If scheduling is based on average time, actual fluctuations will repeatedly break the plan.
These three factors mean that line balancing in 3D printing workshops cannot simply copy conventional assembly-line experience. It must be based on measured standard times and modeled by part family.
2. Methods for Measuring Standard Time
Standard time refers to the time required for a qualified operator to complete a unit operation under standard working conditions. It is usually obtained by correcting observed time with a performance rating factor and an allowance factor:
Standard time = Average observed time × Performance rating factor × (1 + Allowance rate)
In a 3D printing workshop, it is advisable to establish separate time models for each process.
Printing process: Time is mainly equipment occupation time, supplemented by manual intervention such as powder-spreading checks, build chamber cleaning, and build changeover. Equipment time and labor time should be distinguished. The former is used for capacity calculation, while the latter is used for staffing. For example, if a machine requires 14 hours for one build and 0.8 hours of manual intervention, the equipment time is 14 hours per build, while the labor time is 0.8 hours per build.
Depowdering and support removal processes: Time is strongly correlated with part volume, internal cavity complexity, and support volume. It is recommended to take measured samples by part family and establish regression relationships. In practice, a stopwatch-based continuous observation method can be used. Each part should be observed at least 5 to 10 times, averaged after outliers are removed, and then multiplied by a performance rating factor, typically 0.95 to 1.10.
Post-processing and inspection processes: Sandblasting, polishing, heat treatment, coordinate measuring, and other operations are significantly affected by batch size and involve obvious setup time. Time should therefore be split into setup time and per-part time: Total process time = Setup time + Per-part time × Batch size.
The allowance rate is recommended to be 8% to 20% depending on work intensity. Positions involving dust protection and material handling should use a higher value, while seated precision work can use a lower value. Allowance includes personal allowance, fatigue allowance, and operational allowance; it should not be simplified into one uniform number for all jobs.
3. Identifying Bottleneck Processes
Once standard times are available for each process, bottlenecks can be identified objectively rather than by shop-floor intuition. Three common methods are used.
Method 1: Compare process load rates. Calculate the daily load rate for each process as required labor or machine hours for planned tasks divided by available hours. The process with the highest load rate that continuously exceeds 100% is the bottleneck. In 3D printing workshops, bottlenecks often occur in depowdering and support removal or in heat treatment.
Method 2: Observe queue length. Observe continuously for one week and record the amount of work in process (WIP) accumulating in front of each process. If the queue in front of a process continues to grow, its upstream arrival rate is higher than its processing capacity. This is the most intuitive method and also the easiest for shop-floor personnel to accept.
Method 3: Break down overall equipment effectiveness (OEE). If the OEE of a bottleneck process is already close to its theoretical upper limit, it indicates that there is limited room to improve that process through efficiency gains alone. Diversion at the process or scheduling level is then required.
It is important to note that bottlenecks can shift. When the order mix changes from large parts to small parts, the bottleneck may move from printing to post-processing. After automated depowdering equipment is introduced, bottlenecks may be redistributed again. Therefore, bottleneck identification should be reviewed monthly rather than measured once and used indefinitely.
4. Calculating and Improving the Line Balancing Rate
The line balancing rate is an indicator used to measure how evenly workload is distributed across processes:
Line balancing rate = Sum of standard times for all processes ÷ (Bottleneck process time × Number of processes) × 100%
The higher the balancing rate, the closer the workload among processes and the lower the waiting time and WIP. In general discrete manufacturing, the target line balancing rate is above 85%. In 3D printing workshops, because process durations differ significantly, an initial rate of 60% to 70% is already normal. Improvement potential can mainly be released through the following measures.
1. Split and combine processes. Separate standardizable portions from the bottleneck process. For example, rough support removal can be separated from fine finishing. Rough removal can be handled centrally by dedicated personnel, while fine finishing remains on the main line, significantly reducing bottleneck time.
2. Prioritize scheduling around the bottleneck process. Adopt bottleneck-driven scheduling: schedule the bottleneck first, then pull upstream processes forward and push downstream processes according to the bottleneck rhythm. Local high efficiency in non-bottleneck processes is meaningless; only the output of the bottleneck determines the output of the entire line.
3. Set buffers instead of stockpiling materials. Establish a quantified buffer in front of the bottleneck process, usually equivalent to 2 to 4 hours of bottleneck processing capacity, rather than allowing unlimited accumulation. Once the buffer is full, upstream release should stop to prevent WIP from going out of control.
4. Coordinate build strategy with takt time. Link build nesting with downstream processing capacity. When post-processing is the bottleneck, prioritize grouping part families with low post-processing time into the same build. When printing is the bottleneck, increase nesting density to reduce printing time allocated to each part.
5. Develop multi-skilled operators. Assign operators with cross-process skills to the bottleneck process. When accumulation occurs at the bottleneck, personnel from adjacent processes can be temporarily reassigned to provide support. This is the lowest-cost approach for flexible improvement.
5. Implementation Points and Common Pitfalls
When implementing line balancing management, several common pitfalls should be avoided in advance.
Pitfall 1: Replacing part-family time with average time. Taking a single average depowdering time for all parts leads to overly optimistic scheduling for complex parts. Time models must be established by part family, at least distinguishing among simple external shapes, medium-complexity parts, and complex internal-cavity parts.
Pitfall 2: Focusing only on machine uptime. High uptime does not mean high output. If the bottleneck is downstream, the higher the printer uptime, the faster WIP accumulates. A production line should be evaluated by on-time delivery rate and WIP turnover days, not by the utilization rate of a single machine.
Pitfall 3: Treating time measurement as permanent. Process parameter adjustments, equipment upgrades, and increased operator proficiency all change processing time. Standard times should be reviewed quarterly, and any process change must trigger remeasurement.
Pitfall 4: Forcibly splitting processes to improve the balancing rate. Excessive splitting increases transfer and waiting time, which may reduce efficiency instead. Splitting should only be done when the separated portion can be standardized and transfer cost is controllable.
The recommended implementation sequence is: first establish a process list and time model, then identify bottlenecks, then improve the bottleneck, and finally track results using both the line balancing rate and on-time delivery rate. Do not attempt to roll out everything across the entire workshop from the start.
Conclusion
Delivery pressure in 3D printing workshops is, in most cases, not caused by a lack of equipment, but by WIP accumulation resulting from imbalanced takt times across processes. The solution is to replace experience-based estimates with measured standard times, objectively identify bottlenecks through load rates and queue lengths, control WIP through bottleneck-driven scheduling and quantified buffers, and continuously track improvement through the line balancing rate. For a full lifecycle management platform such as lantu3D, covering everything from blueprint design to physical delivery, line balancing data is also the underlying basis for quotation, scheduling, and delivery commitment. Only when time is measured accurately can delivery dates be promised confidently and costs be calculated clearly.
Submit a model, drawing, image or written notes. Engineers will review material, process, finishing and delivery based on actual use.