
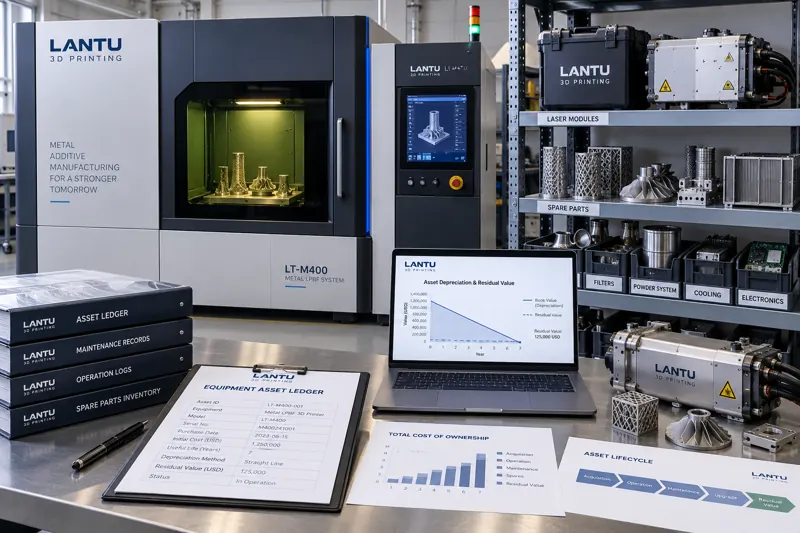
Introduction: On the Day Equipment Acceptance Is Signed, Asset Management Has Only Just Begun
Most 3D printing companies devote substantial effort to equipment investment decisions: capacity calculations, TCO models, ROI payback periods, and comparisons between buying equipment and using service providers. However, once a machine passes site acceptance testing (SAT) and is entered into the fixed-asset register, this rigorous analytical approach often stops. Over the following years, the machine undergoes laser power degradation, galvo calibration, optical-path replacement, software-version iterations, and process-package upgrades, until one day it is tagged out of service because it can no longer meet drawing tolerances or maintenance costs have become excessive—yet this process typically generates no auditable data record.
The result is a severe disconnect between book value and the machine’s actual capability. Retrofit investment and replacement decisions are made by intuition, while retirement residual value is handled as scrap metal by weight. What truly erodes profit over an equipment lifecycle is often not overpaying at purchase, but neglecting the ownership and exit stages.
1. Why Asset Management for 3D Printing Equipment Is More Difficult Than for Conventional Machine Tools
The value-depreciation curve of conventional CNC machine tools is relatively gradual; a machining center can still retain its factory accuracy after ten years of service. Metal 3D printing equipment is different: its value depreciation is driven by three independent yet overlapping curves.
The first is performance degradation of core components. Fiber-laser output power declines with operating hours. A typical industrial 500 W module may experience a 5% to 10% power reduction after 8,000 to 12,000 hours. Galvo-system zero-point drift directly affects contour accuracy, while declining protective-window transmittance causes the actual energy density reaching the powder bed to deviate from the set value. These effects can be offset by replacing components, but the cost of doing so rises as the equipment ages.
The second is generational change in process packages and material systems. The same machine may have been able to reliably print only two or three powders two years ago, yet support more materials and a broader layer-thickness range after a process-package upgrade. Capability and book value can become completely decoupled: the machine’s net book value declines while its productive capability improves.
The third is software and data-chain compatibility. The control software of older equipment may be unable to connect to a new MES or scheduling system, or unable to output layer-by-layer process data. As a result, it may become ineligible to bid for work under new customers’ quality-traceability requirements. This is not an accuracy issue, but a data-capability issue.
Because these three curves overlap, equipment condition cannot be described using a single straight-line depreciation schedule. A layered asset ledger must be established.
2. Depreciation Ledger: Turning Equipment Value Changes into Accountable Data
A practical approach is to establish a dual-track ledger for each machine, comprising a financial layer and a technical layer.
The financial layer follows corporate accounting standards: original value, estimated useful life, residual-value rate, accumulated depreciation, and net book value. Metal 3D printing equipment is typically depreciated over 8 to 10 years, while electronic equipment may be depreciated over 5 years, with a residual-value rate generally set at 3% to 5%. This layer addresses tax and reporting requirements, but provides little support for production decisions.
The technical layer is what matters for management. At a minimum, it should record six condition variables: cumulative operating hours, cumulative recoated layers or build volume, replacement records for critical components (laser, galvos, protective windows, filters, recoater blades), the latest calibration results and deviation values, periodic verification data from standard test coupons, and software and process-package versions. Together, these six items form a profile of the machine’s remaining technical capability.
Viewing the two layers side by side reveals typical risk signals: a machine may retain 40% of its net book value, but its laser has already been replaced twice and critical dimensions on standard test coupons have drifted outside the tolerance band for three consecutive verification cycles. At that point, it is no longer capable of handling high-precision orders, and its book value is not meaningful. Conversely, a machine with only 15% net book value remaining may have just received a process-package upgrade and offer complete process-monitoring data. It may in fact be the most cost-effective production capacity on the line.
The implementation threshold for such a ledger is low: assign each machine an ID, update technical-layer data monthly, and automatically archive maintenance work orders and calibration reports under that ID. The key is consistency, not the sophistication of the system.
3. Retrofits and Replacement: When to Repair and When to Replace
The dividing line between retrofit investment and equipment replacement can be quantified using allocated cost per part.
Let the equipment’s remaining net book value be V, its expected remaining service life be N years, and its average annual available operating time be H hours. The hourly asset cost is approximately V divided by the product of N and H. Maintenance costs must then be added: sum spare parts, consumables, outsourced services, and downtime losses over the past 12 months, then divide by the actual number of parts produced during the same period to obtain maintenance cost per part. If a machine’s maintenance cost per part exceeds 1.5 times the average for comparable machines for two consecutive quarters, and the estimated retrofit cost exceeds 30% of replacement cost, replacement can generally be considered superior to retrofitting.
It is worth distinguishing three types of retrofits. Performance-restoration retrofits, such as laser replacement and optical-path recalibration, restore capability to its factory condition. Their returns can be quantified, so they should receive priority. Capability-expansion retrofits, such as adding melt-pool monitoring modules or upgrading process packages, directly expand the range of orders the machine can handle; their returns depend on incremental order volume. Compliance retrofits, such as dust-collection and emissions upgrades or safety-interlock upgrades, generate no direct return but must be completed for production to continue, and should therefore be treated as mandatory items.
These three categories must be evaluated separately. Including the cost of compliance retrofits in the return model for performance restoration can lead to the incorrect conclusion that investment should not be made. Conversely, including expected capability-expansion benefits in the holding value of aging equipment can delay necessary replacement.
4. Retirement Assessment and Residual-Value Handling: From Storage to Secondary-Market Disposal
Retirement should not be decided only after equipment has completely failed. Four clear decommissioning triggers are recommended: first, critical dimensional capability still cannot meet minimum order requirements after two restorative maintenance attempts; second, annual maintenance cost exceeds 60% of the annual asset cost of a new comparable machine; third, the machine cannot meet mandatory customer requirements for process-data traceability or environmental emissions; fourth, the manufacturer has stopped supplying critical spare parts or software support for more than 12 months.
Meeting any one trigger should initiate a retirement assessment rather than continued operation in a degraded state. The hidden costs of such operation are substantial: it occupies floor space and electricity capacity, consumes maintenance labor, and can disrupt the entire production schedule through a single mid-build shutdown.
Once the retirement process begins, there are four residual-value paths, in descending order of value: resale as a complete used machine, suitable where capability remains sound but capacity has merely been replaced by larger equipment; transaction prices are typically 25% to 40% of new-equipment cost, but complete maintenance and calibration records are required; downgraded internal use, transferring the machine from production to prototyping or training, which generates no cash flow but avoids new-purchase spending; parts recovery and reuse, removing lasers, galvos, filters, recoater blades, and electrical control modules for use as spares on machines of the same model—within companies operating multiple identical machines, this often has greater practical value than selling the complete system; scrapping, with attention to the hazardous-waste classification of residual metal powder and oil-containing components, which must be transferred through hazardous-waste procedures with manifests retained.
Regardless of the path chosen, two tasks must be completed before retirement: first, remove all customer model files, process parameters, and production data from the machine, as required for confidentiality; second, issue an equipment condition report including cumulative operating hours, critical-component replacement history, and the latest calibration data. This report directly determines the used-equipment sale price.
5. How Asset Management Improves the Next Investment Decision
The real value of a lifecycle ledger is that it allows the next investment decision to be based not on theoretical supplier specifications, but on measured data from the company’s own production line.
By entering the actual service life, actual total part output, and actual total maintenance expenditure of retired machines into the TCO model used during initial selection, companies can calculate the model’s deviation rate. If the deviation consistently exceeds 20%, assumptions made during selection regarding consumable prices, downtime rates, or component life were incorrect and should be revised for the next equipment evaluation. Such real-world exit data cannot be obtained from any public source.
A further step is to establish cross-equipment comparisons: rank the total cost per part of different models and brands by quarter, including allocated asset cost, maintenance, consumables, and energy consumption. This table becomes the most reliable procurement shortlist for the next purchasing cycle.
Conclusion
Value management for 3D printing equipment should not end on the day acceptance is signed. The three independent curves of core-component performance degradation, generational change in process packages, and software-data compatibility cannot be captured by a single depreciation period. A dual-track financial and technical ledger is required. The boundary between retrofitting and replacement can be quantified through maintenance cost per part and retrofit cost as a proportion of replacement cost, while performance-restoration, capability-expansion, and compliance retrofits should be accounted for separately. Retirement assessment should use four explicit triggers, and residual-value options should be evaluated in the order of complete-machine resale, downgraded use, parts reuse, and compliant scrapping. Ultimately, real exit data feeds back into the next TCO model, grounding investment decisions in measured production-line performance rather than supplier datasheets.
Submit a model, drawing, image or written notes. Engineers will review material, process, finishing and delivery based on actual use.