
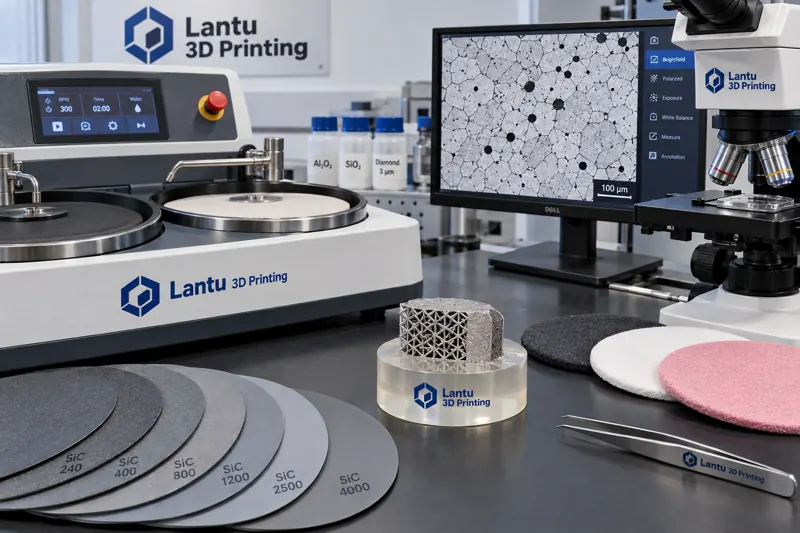
Introduction: Only Visible Microstructures Can Be Controlled
In engineering practice for metal additive manufacturing, what often delays delivery is not the printing itself, but the fact that “we cannot prove the internal quality of this batch of parts.” Tensile specimens pass, dimensions pass, but customers need evidence of fusion condition, porosity level, grain-boundary morphology, and precipitate distribution. Microstructural characterization is the step that translates “whether process parameters are stable” into “verifiable evidence.” However, the validity of characterization results depends first on specimen preparation: a sample with unresolved grinding scratches, rounded edges, or a plastically deformed layer caused by polishing will distort all subsequent image analysis and may even lead to conclusions opposite to the true quality. This article follows the practical engineering sequence and outlines the complete workflow from sampling to interpretation.
1. Engineering Definition of Sampling Location and Orientation
Additively manufactured parts are anisotropic: in the vertical direction, columnar grains grow epitaxially along the heat-flow direction, while in the horizontal direction the structure is equiaxed or nearly equiaxed; pore distribution also varies with height, scan strategy, and heat dissipation through supports. Therefore, sampling must specify three elements: part location (such as the region in contact with the build plate, thin-wall area, or thick-to-thin transition), orientation (parallel to the build direction Z or perpendicular to the build direction XY), and condition (as-built, stress-relieved, after hot isostatic pressing, or after solution treatment and aging). It is recommended that at least one witness coupon be retained for each batch, printed with the actual parts using the same parameters, powder batch, and build layout, as a substitute sample for destructive testing. Sampling locations should be illustrated in the report, because porosity differences of more than 0.3% between different regions of the same part are not uncommon.
2. Key Control Points for Cutting, Mounting, Grinding, and Polishing
Cutting should use a low-damage method with adequate cooling to avoid altering the local microstructure or redistributing residual stress due to cutting heat; the cut should be at least 2–3 mm away from the area of interest. Hot mounting temperature is generally kept below 180 °C, with pressure of 20–30 MPa. For age-hardened aluminum alloys, excessive mounting temperature can cause overaging and softening. For brittle and hard materials prone to false porosity, cold mounting with epoxy resin and vacuum impregnation is preferred to fill connected pores and prevent polishing abrasives from becoming embedded and then being misidentified as defects.
Grinding should proceed through progressively finer steps. A typical sequence is 240#, 400#, 800#, 1200#, and 2000# silicon carbide paper. At each grade change, the sample must be thoroughly cleaned and rotated 90° to ensure that scratches from the previous step are completely removed before moving to the next. This is followed by polishing with 3 μm and 1 μm diamond suspensions, and final polishing with 0.05 μm silica or alumina suspension. For aluminum and titanium alloys, a light etch-and-repolish cycle is recommended during final polishing to remove the surface plastically deformed layer. This layer can obscure real grain boundaries and is the most common reason for the initial judgment that “no microstructure is visible.”
3. Etching: The Final Step That Reveals the Microstructure
Etchants must be selected according to the material system. Keller’s reagent is commonly used for aluminum alloys, with an etching time of 10–30 s, revealing grain boundaries and melt-pool traces. Kroll’s reagent is often used for titanium alloys, typically for 5–20 s, with emphasis on α laths and prior β grain boundaries. Stainless steels and nickel-based alloys may be etched using aqua regia or electrolytic oxalic acid etching, with the latter providing clearer visualization of grain boundaries and precipitates. The criterion for judging etching quality is that a complete grain-boundary network should be visible at 100×, while no large-area blackening or pitting should appear at 500×. Under-etching can lead to missed grain-boundary features, while over-etching artificially enlarges pore size and directly contaminates quantitative image-analysis results for porosity. Etching time records should be established for every batch and noted on the specimen card.
4. Differentiating Pores, Lack of Fusion, and Keyholes
The morphology of voids is more important than their quantity. Gas pores are usually nearly spherical, have smooth inner walls, and are typically 5–50 μm in size; they are often associated with inert gas carried by powder or gas entrainment in the melt pool. Lack-of-fusion defects are flat, elongated lamellar features along layer interfaces, with sharp tips, and are often linked to insufficient energy input or excessive hatch spacing. Keyhole defects are irregular, larger in size, and often accompanied by local collapse morphology, indicating excessive energy input. An inherent limitation of two-dimensional metallographic sections is that spherical pores have a higher probability of being intersected than flat defects, which systematically underestimates the proportion of lack-of-fusion defects. For critical load-bearing parts, industrial CT should be used for three-dimensional verification, with metallography serving as a calibration and validation method.
5. Quantitative Methods: From Area Fraction to Systematic Sampling
Quantitative image analysis of porosity requires clearly defined rules: the recommended magnification is 100–200×, with no fewer than 30 fields of view, using random systematic sampling rather than “photographing the worst area.” Threshold segmentation must be consistent, and the grayscale threshold and image-processing workflow must be stated in the report, because results from the same image can differ by a factor of two under different thresholds. Grain-size rating should be performed using the intercept method or comparison method. The concept of “grain size” itself is not applicable to columnar grains; instead, secondary dendrite arm spacing or columnar grain width should be recorded. For electron backscatter diffraction (EBSD) data, the focus should be on texture intensity and orientation distribution, as their changes directly explain anisotropy in mechanical properties.
6. Feeding Characterization Results Back into the Process Loop
Characterization is not just a photograph in the final inspection report; it is a trigger for process adjustment. When porosity increases, powder reuse cycles, moisture content, and sieving records should be traced first. When the proportion of lack of fusion rises, laser power attenuation, protective-window transmittance, and hatch-spacing compatibility should be checked. When precipitate distribution is abnormal, heat-treatment furnace temperature uniformity and loading method should be verified. It is recommended to establish a four-part record of “batch—parameters—microstructure—properties.” For the same parameter set, at least five batches of data should be accumulated before adjusting the process window, to avoid driving changes based on a single result.
Conclusion
Microstructural characterization of metal additively manufactured parts is a measurement system determined collectively by sampling definition, preparation quality, etching degree, and quantitative rules. Its credibility does not depend on microscope resolution, but on the repeatability of specimen preparation and the consistency of interpretation criteria. Only by formalizing this workflow into operating instructions and feeding each interpretation back into process parameters can microstructural control truly shift from experience-based judgment to a manageable process capability.
Submit a model, drawing, image or written notes. Engineers will review material, process, finishing and delivery based on actual use.