
Introduction: The Invisible Melt Pool Is Where Metal Additive Quality Loss Begins
A laser powder bed fusion machine may print continuously for 18 hours, with layers of powder in the build chamber undergoing tens of thousands of melting and solidification cycles. Any localized energy imbalance—laser attenuation caused by smoke and condensate, a thin powder layer resulting from recoater wear, or a high-melting-point inclusion embedded in a melt track—can leave porosity, lack-of-fusion defects, or keyhole collapse inside the part. The problem is that these defects occur within an enclosed chamber and on a millisecond timescale, beyond the reach of visual observation and conventional inspection methods. By the time industrial CT scanning or metallographic sectioning is performed after printing, material, machine time, and post-processing labor have all been consumed. The cost of rework is often several times the cost of simply continuing the build.
Quality management in metal additive manufacturing is therefore shifting from “post-process inspection” to “process observability.” The objective of in-situ melt pool monitoring and layer-level process quality control is not to classify every layer as pass or fail. Rather, it is to convert the previously invisible build process into a set of continuous signals that can be recorded, compared, and traced, so anomalies are flagged when they occur rather than discovered just before delivery.
1. What In-Situ Melt Pool Monitoring Measures
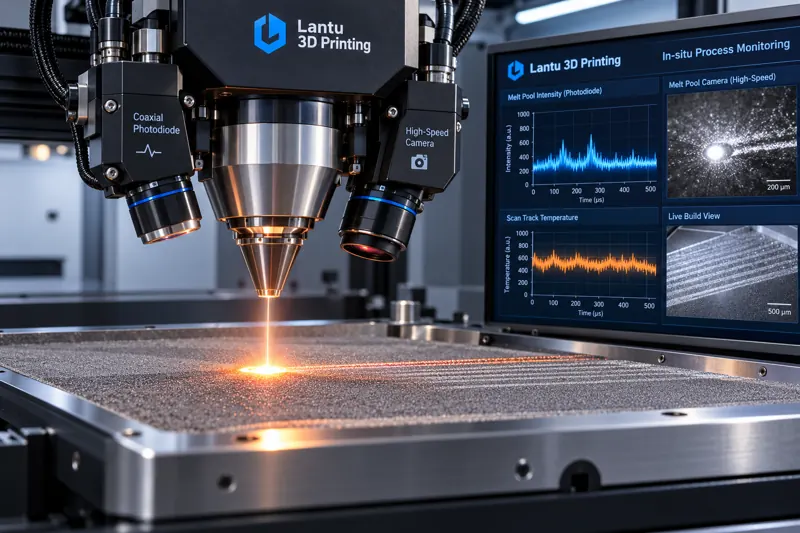
The physical basis of melt pool monitoring is that metal in a high-temperature molten state emits visible and near-infrared radiation. Radiation intensity increases monotonically with temperature, while the radiating area reflects the geometry of the melt pool. By directing this radiation through an optical path to photodetectors or imaging devices, continuous signals related to melt pool condition can be obtained without contacting the melt pool or interfering with the build process.
Typical measurable parameters in practical applications include melt pool radiation intensity, corresponding to relative changes in peak temperature; melt pool area or aspect ratio, reflecting the combined effects of energy input and scan speed; variation in melt pool shape, associated with melt track stability and spatter intensity; and the spatial distribution of melt pool signals, indicating localized anomalies along scan paths. Systems equipped with high-speed cameras can further extract plume morphology in the melt pool wake and the number of spatter particles.
It should be made clear that most in-situ monitoring systems output relative values rather than absolute temperatures. Uncalibrated radiation intensity readings cannot be directly converted into degrees Celsius. This does not limit their engineering value: what matters is signal stability within the same process window and statistical consistency with previously validated conforming builds.
2. Engineering Trade-Offs Among Three Mainstream Sensor Solutions
Photodiode systems represent the most widely installed solution. A beam splitter directs part of the melt pool radiation to detectors operating in two different wavelength bands, and a dual-channel ratio is used to reduce the effects of emissivity variation. Their advantages include high sampling rates, low data throughput, and manageable cost, enabling point-by-point or even sub-millisecond data acquisition. Their limitation is that they provide only aggregate information and cannot distinguish between two fundamentally different conditions: an overall enlarged melt pool and a localized anomalously bright spot.
Coaxial imaging systems integrate a high-speed camera into the laser scanning optical path, directly capturing grayscale images of the melt pool and its surroundings. They provide far more information than photodiodes, enabling extraction of melt pool area and shape as well as identification of spatial features such as spatter, powder ejection, and localized depressions. The trade-off is the enormous data volume: a large, full-platform, multilayer build can generate tens of gigabytes of raw image data, creating clear demands for acquisition bandwidth, storage, and subsequent processing. In practice, not all raw frames are typically retained; features are extracted in real time, and only feature values and anomalous frames are stored.
Interlayer imaging moves beyond the melt pool itself. After recoating and before laser scanning, a camera captures the entire powder bed to monitor powder spreading quality, powder-layer integrity, warping of the previous layer, and balling. Although it does not provide melt pool dynamics information, it can detect pre-process and post-process anomalies such as recoater damage, powder agglomeration, localized powder shortages, and interference caused by warping in the previous layer. It therefore complements melt pool monitoring. A sound combination uses melt pool monitoring to observe the melting event and interlayer imaging to observe recoating and prior-layer condition. Both must share the same coordinate system so anomalies can be located at a specific layer and coordinate.
3. From Signals to Criteria: Thresholds Must Not Be Set Arbitrarily
Installing sensors does not automatically create quality capability. The most common implementation error is to apply simple upper and lower alarm limits directly to signals. Melt pool signals are inherently affected by scan direction, scan length, thermal accumulation from adjacent scan vectors, abrupt changes in part cross-section, and differences between support and solid regions. A fixed threshold will generate frequent false alarms under these normal conditions, ultimately leading operators to disable alarms and rendering the monitoring system ineffective.
A more robust approach is to establish layered criteria. The first layer consists of envelope criteria: using multiple validated conforming builds, signal distributions are compiled for each scan-feature category, such as long scan vectors, short scan vectors, contour scans, support scans, and corner regions, to form dynamic envelope bands. Only points outside these bands proceed to the next level of assessment. The second layer consists of persistence criteria: isolated single-point spikes are often caused by spatter or transient smoke obstruction and do not necessarily indicate a defect. Conditions requiring attention are sustained deviations across multiple sampling points or repeated spatial clustering at the same coordinates within a layer. The third layer consists of correlation criteria: melt pool anomalies are correlated with concurrent powder-bed images, oxygen concentration, and chamber gas-flow condition to determine whether the source is related to energy input, powder, or the build environment.
Once the threshold system has been established, it must undergo an intentional defect validation. Conditions such as insufficient powder, elevated recoater position, defocus offset, and protective-window contamination should be deliberately introduced to confirm that the system reliably reports them at the defined sensitivity while avoiding false alarms on normal parts. Alarm thresholds from a monitoring system that has not undergone intentional defect validation should not be included in process documentation.
4. Data Implementation and Traceability: Ensuring Every Layer Is Documented
The ultimate value of process monitoring lies in traceability. A usable data structure should include part identification, layer number, in-layer coordinates, timestamps, feature values, evaluation results, and the version of the criteria used to make the evaluation. The criteria version is often overlooked, yet it is essential for later review: a part accepted six months ago under criteria version 1.2 cannot be reinterpreted using version 2.0.
For storage strategy, a three-tier structure is recommended: raw signals should be retained for anomalous layers while being downsampled for normal layers; feature values should be stored in full, as they are the foundation for statistical process control; and evaluation results and false-color maps should be archived by part for delivery reports and customer communication. For serial-production parts, the mean and standard deviation of signals for the same part number across different batches are themselves highly valuable indicators of process health. Mean drift generally points to optical-system attenuation or laser aging, while an increase in standard deviation often indicates variation in powder condition or declining recoating consistency.
When integrated with the quality management system, process monitoring data should enter the nonconforming product control process. Anomalous layer ranges should be automatically included in nonconformance reports as input for repair, rebuild, or direct scrap decisions. They should also enter the corrective and preventive action loop to identify whether the root cause lies in equipment, material, or process parameters. This makes process monitoring data highly persuasive process evidence during customer audits and industry certification.
5. Implementation Priorities and Common Pitfalls
Maintenance of the optical path is the first priority. Contamination of protective windows directly attenuates signals, appearing as a gradual, monotonic decline across the entire build area. This drift can easily be mistaken for laser power degradation. A cleaning and replacement schedule for protective windows must therefore be established, followed by a standard test scan after replacement using identical parameters to verify whether signals have returned to baseline. Without this practice, accumulated monitoring data will lose longitudinal comparability within a few weeks.
The second pitfall is coordinate alignment. If the coordinate systems of melt pool signals and the part’s 3D model have a systematic offset, anomaly localization will be incorrect. In severe cases, normal signals from support regions may be incorrectly assigned to solid regions. During installation and commissioning, coordinate calibration must be performed using test parts containing known artificial defects, and recalibration must be performed after machine relocation or optical-path maintenance.
The third pitfall is “emphasizing data acquisition while neglecting response.” If a monitoring system reports an anomaly but no clear graded response rules exist—when to continue observation, when to pause the build, and when to terminate it—the production floor will be forced into ad hoc decisions. A response matrix should be defined in advance in process documentation and embedded into the machine operating interface.
Finally, capability limits must be recognized. In-situ monitoring can significantly improve defect detection rates and process transparency, but it cannot replace destructive validation or first-article qualification. It answers whether a specific part has deviated from a validated normal condition, not whether that part’s performance is acceptable. The two are complementary and cannot replace one another.
Conclusion
Stable serial production in metal additive manufacturing requires process observability. In-situ melt pool monitoring and layer-level process quality control translate millisecond-scale physical events inside an enclosed build chamber into continuous data that can be stored, compared, and traced. This shifts quality management from “sorting out defective parts after the fact” to “intercepting abnormal deviations during production.” The key to implementation is not the sensor itself, but three elements: establishing layered criteria rather than single-point thresholds, maintaining the optical path to preserve longitudinal data comparability, and genuinely integrating anomaly data into nonconforming product control and corrective and preventive action loops. When these three elements are in place, process monitoring becomes not an expensive accessory, but part of the process capability itself.
Submit a model, drawing, image or written notes. Engineers will review material, process, finishing and delivery based on actual use.