Introduction: Green Manufacturing Is Becoming a Measurable Business Indicator
For manufacturing companies, environmental protection is no longer merely a compliance cost. With supply chain carbon data reporting, customer green procurement clauses, and rising energy costs, green manufacturing is becoming a business indicator that can directly enter quotations and delivery documents. 3D printing is known as “additive” manufacturing and naturally has the advantage of high material utilization, but this does not mean it is automatically environmentally friendly—powder loss, equipment standby power consumption, and chemical agents used in post-processing can also consume most of the environmental benefits. The real question is: how can “less waste” be turned into a measurable, replicable, and deliverable management system?
1. Materials Side: Closed-Loop Powder Recycling and Recovery Rate Management
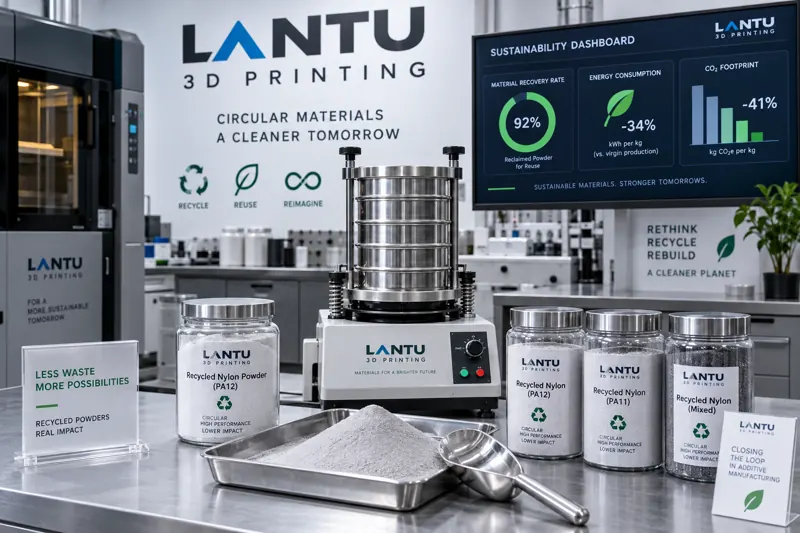
In SLS and SLM processes, unfused powder is the largest recyclable resource, but recycling is not simply a matter of sieving. From an engineering perspective, a three-step closed loop needs to be established: first, after printing is completed, powder should be collected by area, distinguishing “near-part powder” from “far-end powder” to avoid cross-contamination; second, screening equipment with vibrating sieves and air classification should be used, typically filtering agglomerates and large particles through 80–120 mesh screens; third, recycled powder should be mixed with virgin powder at a certain ratio, commonly 20%–50%, with batch mixing ratios recorded. The key indicators are the ratio of virgin to used powder, the moisture content of recycled powder, which is recommended to be controlled below 0.1%, and the oxygen content of each batch. Experience shows that, under standardized management, the comprehensive utilization rate of nylon powder can increase from 60% to over 85%, directly reducing material costs by 8%–15% while also reducing solid waste disposal volume. Metal powder recycling, meanwhile, requires strict control of oxygen increase. Typically, the oxygen content increase of recycled powder should not exceed 200 ppm; otherwise, density and mechanical properties will be significantly affected.
2. Equipment Side: Energy Consumption Structure and Standby Optimization
The energy consumption of additive manufacturing equipment is concentrated in three areas: the heating system, including lasers or heat sources and build chamber heating; the motion system; and auxiliary equipment, including cooling, powder removal, and gas circuits. The continuous operating power of SLM equipment is usually 3–8 kW, while SLS equipment is 5–12 kW, with build chamber preheating and heat preservation accounting for more than 40% in some cases. The most effective optimizations are not complicated: first, batch consolidation, combining parts originally spread across different shifts into the same build to reduce repeated preheating; second, shortening standby time by setting equipment to enter a low-power state when there is no production schedule, avoiding long periods of no-load heat preservation; third, waste heat and gas reuse, recovering heat energy during the cooling stage after printing for post-processing cleaning or workshop heating. Taking a medium-sized workshop as an example, batch consolidation and standby management can usually reduce unit energy consumption on the equipment side by 10%–20%. In regions with high electricity prices, this can cover part of the equipment maintenance budget within a year.
3. Process Side: Near-Net-Shape Forming and Support Minimization
The green leverage of process design is often underestimated. Near-net-shape forming means that after printing is completed, parts require almost no removal of large amounts of material, and waste mainly comes from support structures. By optimizing overhang angles, controlling self-supporting angles within 45°, using topology optimization to reduce volume, and aligning orientations when nesting multiple parts, the proportion of support material can be reduced from the common 20%–30% to below 10%. In addition, nesting can significantly improve the loading rate of a single build. For every 10-percentage-point increase in loading rate, the energy consumption and powder loss per part decrease by roughly the same proportion. These optimizations do not sacrifice quality; instead, they reduce the risk of surface damage during support removal because fewer supports are needed.
4. Post-Processing and Logistics: Reducing Chemical and Packaging Waste
The environmental liabilities of post-processing are often overlooked. Sandblasting, dyeing, and chemical polishing consume abrasives and chemical agents, and wastewater treatment costs are high. Feasible measures include adopting closed-loop sandblasting equipment and recycling abrasives; processing similar parts together to reduce the number of cleaning cycles; prioritizing water-based or low-volatility agents and supporting classified recovery of waste liquids. In terms of packaging, using recyclable molded pulp liners instead of disposable foam and designing standard reusable turnover boxes by part family can reduce both packaging costs and transport damage rates. These actions may seem minor individually, but when aggregated into annual reports, they can usually reduce post-processing consumable expenses by 15%–25%.
5. Carbon Footprint Accounting and Customer Delivery Value
For green manufacturing achievements to be recognized by customers, an accounting framework is essential. It is recommended to establish a data ledger across four segments: materials, equipment, post-processing, and logistics. The materials segment records the weight and source of virgin and recycled powder; the equipment segment records build duration and measured power; the post-processing segment records chemical usage and wastewater destination; and the logistics segment records transportation method and distance. Based on this, the carbon emission intensity per part, in kgCO2e per piece, can be calculated, and the real emission hotspots can be identified. In multiple projects, it can be seen that the materials and equipment segments usually account for more than 70% of total emissions, which is also where optimization should be prioritized. For customers, a traceable carbon data ledger is often more valuable than a simple environmental commitment—it can directly enter customers’ green procurement scoring and annual emissions reduction reports.
Conclusion
The green value of 3D printing is not inherent; it is managed into existence. A closed loop for powder recycling on the materials side, batch and standby management on the equipment side, near-net-shape forming and loading rate optimization on the process side, reduction of chemicals and packaging on the post-processing side, together with an accountable carbon data ledger, collectively form a deliverable green manufacturing capability. Companies are advised to proceed in the sequence of “account first, optimize next, standardize last”: first establish a ledger to understand the baseline, then carry out one or two improvements targeting emission hotspots to verify benefits, and finally write effective practices into operating standards, turning green initiatives from a one-time campaign into a stable business capability.
Submit a model, drawing, image or written notes. Engineers will review material, process, finishing and delivery based on actual use.