
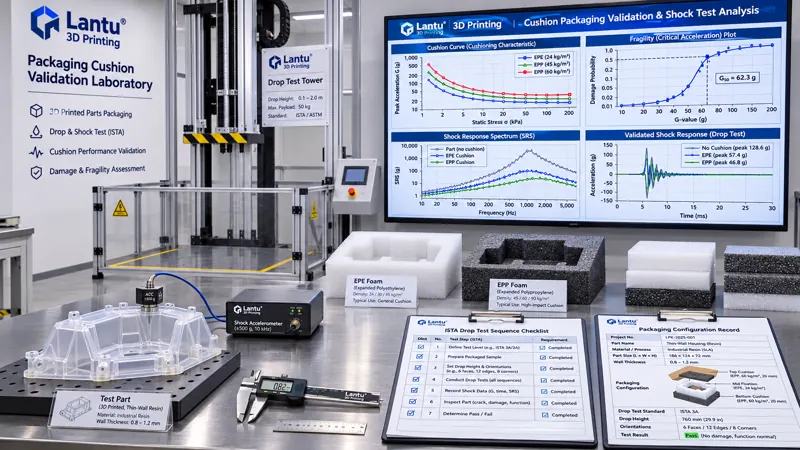
Introduction: Thicker Packaging Does Not Necessarily Prevent Damage
A 0.8 mm wall-thickness vat photopolymerization resin enclosure, a titanium alloy bracket with a 0.6 mm lattice core, or a set of assembly samples that have been sandblasted and anodized typically encounters not sustained pressure during shipment, but a drop impact lasting only tens of milliseconds. When teams encounter transit damage, their first response is often to use thicker foam and additional layers of bubble wrap. The result is either doubled package volume and freight cost, or parts wrapped so tightly that impact acceleration is transmitted almost undiminished to the most fragile thin-wall area. lantu3D considers delivery from digital blueprint to physical product as a complete lifecycle chain. Packaging is not a final shipping procedure; it is an engineering stage whose criteria must be defined during design, validated during prototyping, and documented at release. This article explains how to establish those criteria: how to translate a customer's instruction to “do not let it break in transit” into a measurable G value, how to calculate cushion thickness using cushioning curves, and how to validate a solution to release-signoff level using ISTA and ASTM D4169 drop sequences.
1. Fragility Is an Acceleration Threshold, Not Material Hardness
Fragility, commonly expressed as Gc, is defined as the maximum peak acceleration a product can withstand without functional or cosmetic damage. Its unit is a multiple of gravitational acceleration, g. It cannot be directly converted from tensile strength or hardness. A Ti6Al4V printed part may have high inherent material strength, but if it includes a 0.5 mm cantilever snap feature, its fragility may be only 25–40 g. A tough PA12 nylon enclosure with continuous geometry and generous radii may achieve a fragility of 80–110 g. As an initial rule of thumb, precision assemblies and thin-wall resin parts can be grouped at 25–50 g, general functional parts at 50–85 g, and metal parts with continuous structures and no exposed features at 85–150 g. This grouping is suitable only for initial concepts; final release requires measured calibration because the fragility of 3D-printed parts strongly depends on print orientation, surface notches left after support removal, and whether heat treatment or infiltration sealing has been applied.
Calibration is performed by progressively increasing drop height and using an accelerometer mounted at the stiffest location of the part to record the impact waveform. The level immediately below the first occurrence of objectively verifiable damage is taken as Gc. Damage criteria must be defined in advance as a checklist: CTQ dimensional nonconformance, lattice-cell fracture, coating-loss area, or an assembly fit-force change exceeding ±15%, rather than simply determining that the part “looks fine.” A fragility test without defined damage criteria produces only a meaningless maximum drop height. At least five samples are recommended per group, including the part with the most unfavorable print orientation. Testing only specimens in the vertical direction effectively conceals the weakest anisotropic cross-section.
2. Translating Drop Height into G Value and Pulse Duration
Drop height h is directly related to impact velocity, v = √(2gh), but peak acceleration also depends on the deformation travel s of the cushioning material. The approximate relationship is G ≈ v² / (2gs) = h / s. Thus, at the same drop height, greater allowable deformation travel results in lower acceleration transmitted to the product. For h = 760 mm, a common ISTA 2A drop height, and cushioning travel s = 25 mm, G is approximately 30. If the cushion is compressed so that only 8 mm of effective travel remains, G rises to approximately 95, enough to damage a thin-wall part with a fragility of 40 g. Impact pulse duration is equally important. Half-sine pulses typically last 10–30 ms. If the natural frequency of a 3D-printed lattice structure falls within 80–200 Hz, proximity between the pulse's dominant frequency and the natural frequency can cause resonant amplification, with measured peaks reaching 1.5–2 times the quasi-static estimate. Therefore, calculation based only on h/s is insufficient. A shock response spectrum should be used to assess the part's natural-frequency range. If needed, adjust cushion stiffness to shift the pulse dominant frequency away from that range, or add local reinforcing ribs to increase the first natural frequency above 300 Hz.
An engineering reference table can be established for product weight, fragility, drop height, and required minimum travel. For example, for a 1.2 kg product with Gc = 45 g and h = 760 mm, applying a safety factor of 1.3 gives a target peak of ≤35 g. The required travel is s ≥ h/G ≈ 22 mm. Adding a 3 mm creep allowance results in a final cushion thickness of 25–30 mm. This table becomes the input for subsequent selection and testing, and the basis for making packaging designs auditable.
3. Reading Cushion Curves: Material, Density, and Static Stress
Cushioning material performance should be expressed using a cushioning coefficient C versus maximum stress σ curve, or an acceleration versus static stress curve, rather than described as simply “soft” or “hard.” Static stress is σ = W/A, where W is product weight and A is the load-bearing area of the cushion. The G value transmitted by the same material can vary by several times at different σ values. EPE, expanded polyethylene with a density of approximately 25–30 kg/m³, performs well in the σ = 2–8 kPa range. EPP, expanded polypropylene at 30–60 kg/m³, has good resilience and is suitable for repeated impacts and reusable shipping cycles. Flexible PU foam is suitable for very low stress but is prone to creep. Paper honeycomb and corrugated structures are more efficient at relatively high σ and are less sensitive to temperature and humidity. Selection should begin by calculating σ from W and the available contact area, then using the applicable material curve to identify the minimum thickness that meets the target G value, rather than selecting a thickness first and relying on trial and error.
Corrections for at least three repeated impacts and for temperature and humidity must also be included. After 72 hours at 40 °C and 90% RH, EPE compression creep can reach 8–15%. Reduced effective travel increases peak acceleration. Metal powder parts and moisture-absorbing nylon parts have additional internal-package humidity requirements. Desiccants and barrier bags consume cushioning space and must be accounted for in thickness calculations. Treating success in a single drop as proof of a qualified design is one of the most common root causes of recurring transit damage. In actual distribution, the same carton may experience 6–12 impacts in different orientations during sorting, handling, and transfer.
4. Joint Calculation of Cushion Thickness and Area
The complete calculation chain can be expressed in four steps: ① determine the target peak acceleration Gt = Gc / 1.3 from product weight W and fragility Gc; ② calculate minimum travel smin = h / Gt from drop height and Gt; ③ use the material cushioning curve at σ = W/A to determine thickness t required to achieve Gt, ensuring t ≥ smin + creep allowance; and ④ verify puncture resistance and bottom compressive loading to prevent thin-wall sharp corners from puncturing the cushion during impact and creating point contact. In this case, corner protection or increased local load-bearing area is required. For example, with W = 12 N, Gc = 50 g, and h = 760 mm, Gt ≈ 38 g and smin ≈ 20 mm. If contact area A = 0.006 m², σ = 2 kPa. The curve for EPE at 30 kg/m³ indicates approximately 35 g at t = 28 mm, satisfying the criterion. If the area is reduced to 0.002 m², making σ = 6 kPa, G rises to approximately 60 g at the same thickness and the design fails immediately. This demonstrates that area and thickness are two variables in the same equation; increasing thickness without distributing the contact area is often ineffective.
5. Validation Plan: ISTA and ASTM D4169 Drop Sequences
The design must be validated within a standardized test sequence. ISTA 2A applies to packaged products weighing ≤68 kg. A typical sequence includes temperature and humidity preconditioning, fixed-displacement or random vibration, and multiple drops in face-edge-corner order, commonly 10 drops. Drop heights are weight-dependent; packages weighing 1–10 kg are commonly dropped from 760–970 mm. ASTM D4169 defines distribution cycles by DC and can combine stacking, vibration, drop, and low-pressure testing, making it suitable for projects requiring alignment with customer logistics conditions. For precision 3D-printed parts, the most unfavorable face and edge should be additionally tested because the weak axis of a printed part is often coupled with package orientation. A vertically built specimen may have weaker interlayer bonding; if it lands in that direction, its damage threshold can be significantly lower than face-drop results indicate.
Validation records should at minimum include sample ID and print orientation, packaging configuration revision, cushioning material batch number and measured thickness, accelerometer location and sampling rate (≥5 kHz), peak G and pulse width for each impact, post-test CTQ reinspection values and cosmetic assessment, and the person approving the conclusion. Release criteria should state “peak acceleration ≤ Gt, all CTQ reinspections conform, and no coating loss,” rather than “the package is undamaged.” A carton may remain intact while the internal part has already failed, which is precisely the condition most difficult to identify during receiving inspection. If customers require in-transit traceability, impact indicator labels can be linked to the packaging configuration revision so that abnormal lots can be traced back to a specific cushioning batch.
6. Boundary Conditions Specific to 3D-Printed Parts
Three situations require separate treatment. First are lattices and thin walls. These structures usually fail through local buckling rather than overall fracture, and their fragility has high variation: Gc values among samples from the same lot may differ by ±30%. Sample size should therefore be increased to eight, with a conservative percentile, such as the 10th percentile, used as the design value. Second is post-processing condition. Residual burrs from incomplete support removal become stress concentrators, while surface compressive stress introduced by shot peening or burnishing can improve impact-fatigue resistance. The fragility of identical geometries in the as-printed and finished states should be calibrated separately, and packaging configurations should be controlled together with process-route revisions. Third is mixed-part packaging. Parts of different materials and weights can collide within the same carton. They must be separated into individual compartments, and the Gc of the most fragile part must serve as the design input for the entire package. Selecting cushioning based on average weight exposes the lightest and most fragile part to the highest risk.
7. A 30-Day Implementation Checklist and Five Failure Modes
Implementation can be divided into four steps. In week 1, classify deliverable parts into 3–5 fragility families by geometry and post-processing condition. Complete calibration with 5–8 samples per family and document the results in a Packaging Fragility Card containing Gc, sampling orientation, surface condition, damage criteria, and calibration date. In week 2, establish a material cushioning-curve library and static-stress reference table, and select one or two cushioning materials for each family. In week 3, complete validation according to ISTA 2A or the customer-specified distribution cycle, creating a packaging configuration revision and release record. In week 4, link packaging configurations to order and delivery records so every transit-damage incident can be traced back to a specific curve revision and cushioning material batch.
Five frequent failure modes are: ① selecting foam only by weight without measuring fragility; ② using a single face drop instead of a multi-orientation sequence, thereby missing the weakest edge or corner; ③ ignoring creep and temperature-humidity effects, causing effective travel to decrease after three months of warehouse storage; ④ insufficient area causing sharp corners to puncture the cushion and create point contact; and ⑤ packaging configurations lacking revision control and records, making it impossible to determine after transit damage whether the cause was a design issue or a batch issue. The first four are engineering calculation issues; the fifth is a management closed-loop issue. What lantu3D emphasizes is connecting design criteria, validation records, and physical delivery into a single traceable chain.
Conclusion
The essence of cushioning packaging is not adding another layer of material. It is translating “do not let it break in transit” into four calculable, measurable, and auditable variables: Gc, h, σ, and t, then using standardized drop sequences to validate the assumptions. For 3D-printed parts, print orientation, lattice weak axes, support residues, and post-processing condition can all change fragility. Calibration must therefore include the most unfavorable samples, and release criteria must be based on CTQ reinspection rather than carton appearance. By linking fragility cards, cushioning-curve libraries, packaging configuration revisions, and delivery records, packaging becomes an engineering capability that is deliverable, auditable, and continuously improvable rather than merely a shipping action.
Submit a model, drawing, image or written notes. Engineers will review material, process, finishing and delivery based on actual use.