
Introduction: If Energy Costs Cannot Be Explained, Cost Reduction Becomes Guesswork
At cost review meetings in 3D printing workshops, one of the most common conclusions is: “Electricity costs were high this month; everyone should pay attention to saving energy.” The problem with this statement is that it cannot be acted upon: high compared with what? Which machine, which process, or which product category is responsible? Is the printing stage consuming too much energy, or are post-processing and auxiliary systems the issue? If the answer is “we don’t know,” subsequent energy-saving actions can only remain at the level of marginal measures such as turning off lights or adjusting air conditioning. In providing full-lifecycle delivery for small-batch metal and polymer parts, lantu3D has found that most workshops do not lack the willingness to save energy; they lack a practical accounting basis for energy consumption. Without sub-metering, there is no unit energy consumption. Without unit energy consumption, it is impossible to determine whether process parameter adjustments actually save electricity. Without peak-valley data, it is impossible to judge whether moving certain orders to off-peak periods is truly cost-effective. This article is not about broad green manufacturing concepts, but about breaking energy consumption down from a single total account into engineering data that can be attributed, compared, and assessed.
1. Define the Basis First: What Exactly Is the Denominator for Unit Energy Consumption?
The first step in energy accounting is not installing meters, but standardizing the denominator. Common approaches include “per part,” “per kilogram,” and “per machine-hour.” Each of these three bases has its own applicable boundaries, and mixing them will inevitably lead to contradictory conclusions. For metal parts made by powder bed fusion, build time is strongly correlated with part volume, height, and number of layers, but less strongly correlated with the net weight of the finished product—because supports, baseplate preheating, and powder spreading cycles also consume electricity. Therefore, for metal parts, it is more appropriate to use “per kilogram of powder input” or “per build hour” as the primary basis, while using “per part” as the communication basis for customer quotations. For polymer parts made by FDM and SLS, the difference between material input and finished-product weight is relatively controllable, making “per kilogram of finished product” more intuitive.
A more rigorous approach is to establish dual bases: an internal primary basis for process benchmarking, such as kWh/kg of powder input or kWh/build hour, and an external basis for quotations and carbon footprint disclosure, such as kWh/part. The two bases should be connected by a stable conversion factor. For example, if the average ratio of powder input to net finished weight for a certain type of titanium alloy part is 1.8 to 2.4, that factor must be regularly updated through regression using actual batch data, rather than relying on the empirical value from the time the production line was built. An unclear denominator definition is the primary reason energy consumption data loses comparability.
2. Sub-Metering: Split the Master Meter into Four Attributable Layers
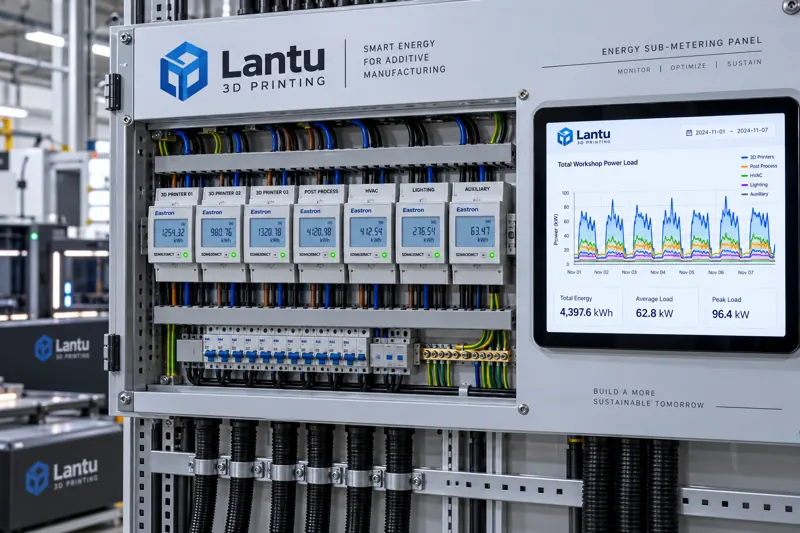
A workshop master meter can only answer “how much money was spent,” not “where the money was spent.” It is recommended to establish at least four layers of sub-metering. The first layer is the main circuit of the build equipment, covering the laser or electron beam generation system, galvanometers and motion axes, and baseplate heating. This is the main energy consumer and typically accounts for 55% to 70% of total machine electricity use in metal powder bed systems. The second layer is auxiliary systems, including chillers, air compressors, dust collectors, and inert gas purification and circulation. This portion is often underestimated and can account for 25% to 35% in actual measurements. The third layer is post-processing equipment, covering heat treatment furnaces, blasting, cleaning, and inspection. The fourth layer is environment and lighting, which belongs to workshop overhead.
Implementation does not require installing smart meters everywhere at once. It can proceed according to the principle of “mandatory installation on main lines and sampling on branch lines”: first install DIN-rail meters with Modbus or MQTT output on main circuits, with a sampling interval of 1 to 5 minutes; then use portable clamp meters on branch circuits for a two-week sampling measurement to obtain the power baseline and start-stop patterns of each auxiliary device, before deciding whether to install permanent metering points. The choice of sampling interval has practical implications: laser scanning power can fluctuate at the second level between layers, and a one-minute average is sufficient for cost accounting, but if process anomaly diagnosis is required, the interval should be increased to the second level and synchronized with equipment status words.
3. Standby and Idling: The Overlooked Hidden Baseline
Once sub-metering is put online, the most common discovery is that standby power consumption accounts for far more than expected. If a metal powder bed machine continues to maintain baseplate heating and inert gas circulation after the build is completed, its standby power can reach 20% to 40% of the build-stage power. If order transitions are not tight, the actual build time in a 24-hour day may be only 9 to 12 hours, while all remaining energy consumption enters overhead. The same is true for chillers and air compressors: if an air compressor is oversized and the compressed-air load fluctuates sharply, unloaded power during frequent loading and unloading can still reach 30% to 50% of full-load power.
The way to make this hidden baseline visible is to calculate the “effective energy consumption ratio,” meaning the proportion of equipment total electricity use that occurs during the build stage. If this indicator is below 50%, it usually means there is room for improvement in production scheduling continuity, automatic shutdown strategy, or auxiliary system selection. The improvement actions are not complicated: set up staged standby after build completion, such as stopping baseplate heating first and then stopping gas circulation after a delay; combine orders into build batches to reduce cold starts; and add variable-frequency drives and air receivers to stabilize air compressor pressure. The common prerequisite for these measures is having sub-metered data first; otherwise, their effects cannot be verified.
4. Peak-Valley Tariffs and Scheduling: Introducing Energy Unit Price into Process Decisions
Most industrial users are subject to time-of-use electricity pricing, and the difference between peak and off-peak unit prices can reach two to three times. Once time-segmented energy consumption data is available, scheduling gains a real optimization dimension. However, there is a common misconception: not all processes are suitable for peak shifting. Processes that should be shifted are those with high power per unit time and low sensitivity to delivery rhythm, such as annealing heat treatment for large batches of parts, long-duration baseplate preheating, and non-urgent powder sieving and drying. By contrast, sample parts, first articles, and urgent parts waiting for customers should not be delayed for electricity pricing, because the cost of delivery default is far higher than the electricity price difference.
The quantitative method is to calculate “shiftable electricity use” and a “peak-shifting risk coefficient” for each type of process. Shiftable electricity use comes from historical time-segmented statistics generated by sub-metering. The risk coefficient is jointly determined by delivery commitments, work-in-process inventory, and post-processing bottlenecks. Incorporating these two items into scheduling rules is more executable than simply requiring “more machines to run during the night shift,” and it is also easier to build internal consensus.
5. Attribution Analysis of Unit Energy Consumption: From Data to Process Parameters
The ultimate value of energy consumption data lies in guiding processes. Consider a typical scenario: the same batch of parts is built using layer thicknesses of 0.03 mm and 0.06 mm respectively. The 0.06 mm option significantly shortens build time and appears to save electricity. However, if the 0.06 mm option leads to unacceptable surface quality and requires additional abrasive flow polishing or longer blasting time, then after post-processing energy consumption is included, the total unit energy consumption may instead be higher. This is exactly why four-layer sub-metering data must be connected and aggregated by work order number—optimization of a single process often merely transfers energy consumption from one stage to another.
The recommended approach is to establish an energy ledger by work order: work order number, part number, material category, build equipment, build duration, build electricity consumption, post-processing electricity consumption, allocated auxiliary system consumption, number of finished parts, and number of conforming parts. The field for conforming parts is critical: only by allocating the energy consumption of reworked parts to conforming parts can the real delivered unit energy consumption be obtained. After this basis was introduced for a certain type of stainless steel part, unit energy consumption increased by about 12%, precisely because the energy consumption of reworked parts had not previously been correctly attributed.
6. Data Credibility and Assessment: Avoiding Gaming of Energy Indicators
Once energy consumption enters performance assessment, there is a risk that it will be gamed. The most common practice is “selective scheduling”—concentrating high-energy-consumption orders outside a particular statistical period. The preventive measure is to assess both the mean and variance of unit energy consumption and require work-order-level details to be traceable. The second issue is measurement error in the meters themselves. Periodic interim checks should be performed, using comparison with a standard meter or cross-verification with meters of the same model, and meters should be replaced promptly when errors exceed class requirements. Third, any change in the accounting basis must have version records: adjustments to denominator definitions, allocation rules, and auxiliary system allocation coefficients must all be documented; otherwise, cross-period comparisons lose meaning.
This requirement is consistent with the logic of measurement system analysis in quality management systems: any data used for decision-making must first answer the question, “Is this data itself credible?” Energy consumption data likewise requires interim checks, error evaluation, and assessment of sample representativeness. Otherwise, energy-saving decisions based on incorrect data may be worse than making no decision at all.
7. From Energy Consumption to Carbon Footprint: The Accounting Boundary Must Be Clear First
When customers begin to require product carbon footprint data, energy consumption data becomes a core input. At this point, the accounting boundary must be clearly defined. It is generally recommended to use a scope from raw material input to finished product shipment, covering build, post-processing, and auxiliary systems, but excluding upstream powder smelting and downstream transportation unless the customer explicitly requires a full lifecycle assessment. Emission factors should preferentially use the latest regional factors published by the local power grid, rather than generic default values. If the workshop has self-built photovoltaics, the deduction rules for self-generated and self-consumed electricity must be explained. Once boundaries and factors are determined, they should be fixed in the wording of quotation or delivery document templates to avoid the same company providing figures to different customers that cannot corroborate one another.
Conclusion
The truly difficult part of optimizing energy consumption is not finding energy-saving measures, but making the effects of those measures verifiable. The executable path is as follows: first standardize the basis for unit energy consumption and the conversion relationship between primary and auxiliary bases; then establish four-layer sub-metering using a strategy of mandatory installation on main lines and sampling on branch lines; next use the effective energy consumption ratio to expose the hidden baseline of standby and auxiliary systems; then incorporate time-of-use tariffs and shiftable electricity use into scheduling rules; aggregate full-process energy consumption including rework by work order for attribution analysis; and finally ensure data credibility through interim checks and version management of allocation rules. Once this foundational work is complete, equipment selection, process parameter adjustment, and carbon footprint disclosure can all draw conclusions from the same traceable dataset, rather than relying on experiential judgment.
Submit a model, drawing, image or written notes. Engineers will review material, process, finishing and delivery based on actual use.