
Introduction: Why Risk Management Often Remains at the Slogan Level
In 3D printing service projects, risk management is nearly always mentioned at project kickoff meetings. Yet at the execution level, most teams have only a generic Project Risk Contingency Plan, typically containing unverifiable statements such as “enhance communication,” “provide early warnings,” and “maintain backups.” When delivery deadlines approach, delays, rework, and cost overruns follow one another. Only during retrospective reviews does it become clear that risks were not unidentified—they were simply not quantified or assigned to specific people and dates.
This article addresses the technical layer of risk management rather than the management-system layer. Instead of discussing how to build a risk-management culture, it answers three practical questions: How should risks be registered and structured? How should Severity, Occurrence, and Detection be scored to calculate RPN? How can a risk register be linked to project milestones to form an auditable closed loop?
1. Risk Registers: Turning Risks from Adjectives into Data Structures
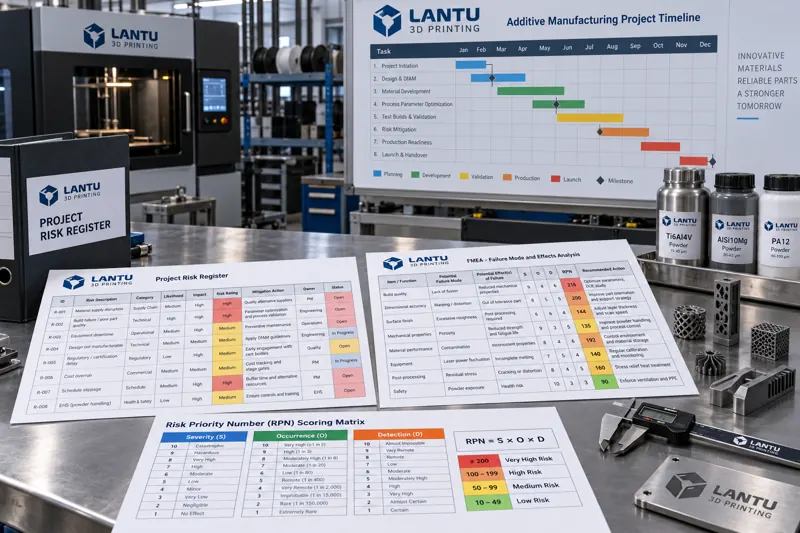
A usable risk register should include at least the following fields for every risk: risk ID, risk description (trigger condition plus consequence, rather than a broad noun), affected project objective (schedule/cost/quality/compliance), owner, identification date, trigger threshold, response category (avoid/transfer/mitigate/accept), residual risk rating, status, and closure date. The most commonly missing field is the trigger threshold. A risk without a threshold cannot be monitored because no one knows when it changes from latent to actual.
Consider the following comparison. Vague wording: “Printing failure risk.” Structured wording: “R-014: A Ti6Al4V thin-wall part (wall thickness: 1.2 mm) may warp and crack during LPBF processing because of concentrated thermal stress. The trigger condition is a warpage rate above 5% within a single batch. The affected objectives are schedule and cost. The owner is the process engineer. Mitigation includes adding a stress-relief annealing step and adjusting the build orientation to 30°. Residual rating: medium.” The latter can be directly entered into a tracking sheet; the former can only remain in meeting minutes.
2. FMEA: Moving from Brainstorming to Computable Priorities
Failure Mode and Effects Analysis (FMEA) provides a unified quantitative framework for risks. For 3D printing projects, it can be applied at two levels: Process FMEA (PFMEA) for processes such as building, support removal, heat treatment, machining, and inspection; and Design FMEA (DFMEA) for part geometry and material selection.
Scoring uses three dimensions: Severity, S (1–10, seriousness of the impact on the customer); Occurrence, O (1–10, frequency of the failure cause); and Detection, D (1–10, ability of current controls to detect the failure before delivery, where a higher score means more difficult detection). The Risk Priority Number is calculated as RPN = S × O × D, with a theoretical range of 1–1,000.
Consider lack of fusion in metal LPBF: S = 8 (internal defects affect fatigue life and may cause in-service fracture); O = 4 (it occurs when energy density falls below the threshold and powder spreading is uneven, with historical data indicating approximately one abnormality per ten batches); D = 5 (industrial CT can detect it, but sampling coverage is limited and costly). The RPN is 8 × 4 × 5 = 160, placing it in a priority-treatment range. If powder-spreading consistency is added to online monitoring, D can decrease from 5 to 3, reducing RPN to 96. If parameter-window validation also reduces O from 4 to 2, RPN falls to 48.
3. Scoring Consistency Matters More Than Absolute Values
Different engineers often assign scores that differ by two or three points for the same failure mode, directly distorting RPN rankings. The solution is not to pursue absolute precision, but to establish a shared scoring-anchor table for the team, with specific observable criteria for every score. For example, Severity 8 may be anchored as “loss of function without a safety incident; detectable by the customer and requiring rework.” Occurrence 4 may mean “appears in one to two out of ten comparable historical projects.” Detection 5 may mean “dependent on sampling or offline inspection, with coverage below 30%.” With an anchor table, scoring variation among personnel decreases significantly, allowing RPN rankings to support decisions.
It is also recommended to introduce Action Priority (AP) as a supplement to RPN. The RPN multiplication model has an inherent limitation: S = 10, O = 2, D = 2 and S = 2, O = 5, D = 4 both yield an RPN of 40, but the former is a high-severity safety-incident risk that must be addressed first, while the latter is merely a minor cosmetic issue. High-severity risks (S ≥ 9) should be designated as automatic priorities and should no longer rely on RPN ranking.
4. Linking the Risk Register to Project Milestones
The point at which risk management most often fails is when the completed register is simply archived. An effective approach is to link risk items to milestone review gates. At every milestone review, only three tasks should be performed: update detection results for existing risks, identify new risks, and verify whether actions for closed risks have actually been implemented. The review output should not be meeting minutes, but a version-change record for the register, including the person making the change, the time of change, and the reason for change.
For 3D printing projects, four mandatory risk-review gates are recommended: order review (technical feasibility and quotation boundaries), first article inspection or FAI (whether the process window has been established), low-volume ramp-up (whether yield and cycle time are stable), and production release (whether supply chain and capacity are aligned). Each gate corresponds to different dominant risk types: order review focuses on requirements and technical-feasibility risks; first article stages focus on build-process risks; ramp-up focuses on consistency and capacity risks; and volume production focuses on supply and change-management risks.
5. Implementation Priorities and Common Pitfalls
First, risk-response actions must distinguish between preventive controls and detection controls. Preventive controls reduce Occurrence, O, while detection controls reduce Detection, D. Simply stating “strengthen inspection” is a detection control; it cannot reduce the probability of failure occurrence. Confusing the two leads to overestimating the reduction in RPN.
Second, risk closure must be supported by evidence. After actions are implemented, RPN should be recalculated and accompanied by validation data, such as CT inspection reports, first-article dimensional reports, and batch-yield curves, rather than relying on an owner's subjective judgment that the issue has been resolved.
Third, avoid treating the risk register as a one-time document. Risks are dynamic: design changes, material batch replacements, and post-maintenance equipment conditions should all trigger reassessment of the register. The engineering change notice (ECN) process must be integrated with the risk register; otherwise, new failure modes introduced by changes will remain outside the management system.
Fourth, control the analysis cost. FMEA is not better simply because it is more detailed. It is generally sufficient to expand analysis by process down to the failure-mode level; unlimited breakdown to individual part-feature level is not recommended. Mature processes with RPN consistently below 50 and no history of customer complaints can be downgraded to periodic review, concentrating analytical resources on high-risk and newly introduced processes.
Conclusion
To move 3D printing project risk management beyond the problem of “well-written plans with no execution evidence,” three elements are essential: use structured fields to register risks as trackable data, use FMEA's S/O/D scoring dimensions to calculate priorities, and use milestone reviews to turn the register into a continuously updated living document. RPN and severity thresholds provide the basis for prioritization, scoring-anchor tables ensure consistent team criteria, and recalculation plus evidence archiving after action implementation determine whether risk management is merely process decoration or genuine delivery assurance. For a full-lifecycle management platform such as lantu3D, spanning design blueprints through physical delivery, placing risk records, process parameters, inspection records, and change history on the same data chain enables risk management to become a searchable, reusable, and verifiable engineering asset.
Submit a model, drawing, image or written notes. Engineers will review material, process, finishing and delivery based on actual use.