
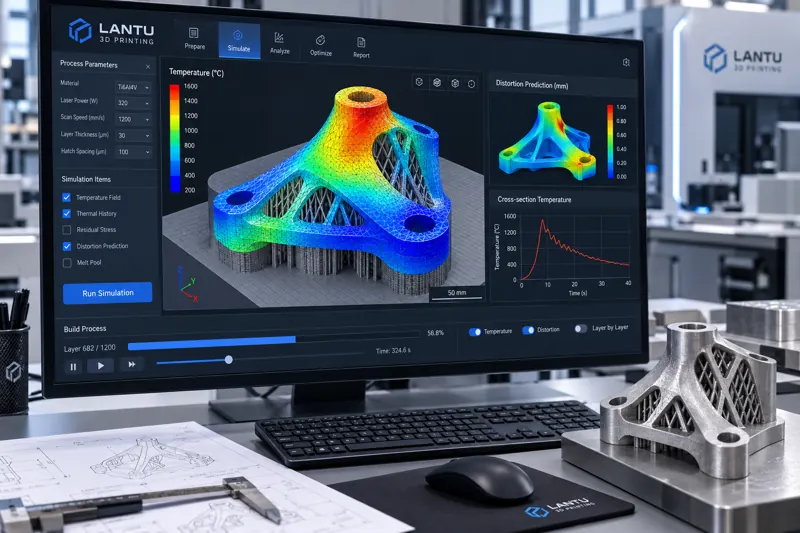
Introduction: Why Defects Are Often Discovered Only After Printing
In actual production with metal SLM, nylon SLS, and photopolymer SLA, engineers often face the same dilemma: the model looks perfect and the slicing parameters follow the standard, yet once the part comes off the machine, warping, cracking, dimensional deviation, or difficult support removal appears. The traditional approach is print—measure—rework, with each trial-and-error cycle taking hours or even days and consuming thousands in material and machine time. The value of process simulation is that it exposes these risks computationally before the “start” button is pressed, allowing design iterations to happen on the screen rather than inside the build chamber.
1. Three Core Targets of Process Simulation
3D printing simulation is not a single tool; it is built around three physical scales: thermal, mechanical, and geometric. The first is thermal simulation, which calculates the temperature field and melt pool evolution caused by laser or heat-source deposition, identifying local overheating and lack-of-fusion zones. The second is mechanical/deformation simulation, which solves warpage displacement and residual stress distribution on the build plate based on layer-by-layer thermal cycling. The third is support and geometry simulation, which evaluates whether overhanging areas are stable and whether supports are too dense, causing stress concentration or difficult removal. For SLM metal parts, thermo-mechanical coupled simulation is mainstream; for SLS nylon, the focus is shrinkage and warpage prediction; for SLA photopolymer, curing shrinkage and interlayer peeling force are more important.
2. SLM Metal: Quantifying Everything from Temperature Fields to Residual Stress
In metal powder bed fusion, each layer of the melt pool experiences instantaneous temperatures above approximately 1500°C and then cools rapidly, with interlayer thermal gradients reaching the order of 10⁵ K/m. This uneven thermal cycle accumulates tensile stress inside the part. When the stress exceeds the material’s yield strength, warping occurs; when it exceeds fracture toughness, cracking occurs directly. In engineering practice, the inherent strain method is often used to simplify the complex layer-by-layer thermal process into an equivalent strain applied to each layer, enabling whole-part deformation prediction within minutes. This can then be supplemented by high-fidelity sequential thermo-mechanical simulation to verify critical areas. For example, for a 200 mm × 150 mm thin-walled bracket, simulation can predict an upward warpage of about 0.4–0.8 mm at the free end. Based on this, increasing build plate preheating from 80°C to 120°C and switching the scan strategy to island scanning can reduce measured warpage by around 40%.
3. SLS Nylon and SLA Photopolymer: Different Sources of Shrinkage and Warpage
Although nylon SLS does not require supports, the overall shrinkage rate after powder sintering is often between 2% and 4%, with clear anisotropy—the long-edge direction usually warps more severely than the short-edge direction. Simulation should focus on calibrating the material’s shrinkage tensor and the friction constraint between the first layer and the base. SLA photopolymerization produces lateral shrinkage and vertical peeling force during curing of each layer. Parts with deep cavities or large flat surfaces can easily crack at the moment of release due to uneven peeling force. For these processes, simulation can provide clear recommendations, such as which areas need thicker transitions and which areas should use lower exposure per layer, rather than relying on repeated trial prints based on experience.
4. Support Optimization: Less Is More
Supports are both protection against warping and a burden in terms of cost and post-processing. Simulation-driven support optimization follows three principles. First, generate supports only where overhangs truly require them, using self-supporting angles—commonly 45°–50°—to reduce redundant supports. Second, control the support density gradient, increasing density in thermal stress concentration areas and reducing it in stable areas to avoid a situation where there is “more support than part.” Third, balance removal difficulty, prioritizing line or tree supports to reduce post-processing time. One often overlooked point is that excessive supports can lock stress into the part due to overly strong constraints; after removal, that stress is released as deformation. Simulation can compare displacement in both “with support” and “after support removal” states to identify the optimal solution.
5. Turning Simulation into an Executable Closed Loop
Simulation does not end with producing a contour plot. A mature engineering workflow is a four-step closed loop of “calibration—prediction—measurement—feedback”: first, use 2–3 representative parts to measure deformation and calibrate simulation parameters, such as powder absorptivity, heat dissipation coefficient, and inherent strain
Submit a model, drawing, image or written notes. Engineers will review material, process, finishing and delivery based on actual use.