
Introduction: The “Source” Problem of Quality Data
Across the full lifecycle at lantu3D, from design blueprint to physical delivery, every inspection report, every First Article Inspection (FAI) record, and every return decision depends on a series of measurement data. Yet many teams focus their efforts on printers and process windows while overlooking the reliability of the data itself. For the same part, measurements taken with different gauges, by different operators, or at different times may differ by dozens of microns, while the typical tolerance band for metal 3D printing is often only ±0.1 mm or even tighter. If the measurement system itself is not trustworthy, all subsequent Statistical Process Control (SPC), Process Capability Index (Cpk), and pass/fail decisions are built on sand. Measurement System Analysis (MSA) and gauge control are the fundamental methods that make “trusted data” engineering-driven and quantifiable.
1. What Are Measurement System Analysis (MSA) and Gauge R&R?
Measurement System Analysis is a set of statistical methods used to evaluate errors in the “measurement process.” Its subject is not the part, but the measurement system itself, including gauges, reference standards, operators, environment, and methods. In 3D printing, the most common evaluation is Gauge Repeatability and Reproducibility (Gauge R&R). Repeatability examines the consistency when the same operator uses the same gauge to measure the same feature multiple times. Reproducibility examines deviations among different operators or different equipment. For the cylindricity or flatness of an SLM metal part, if Gauge R&R variation accounts for too large a proportion of the tolerance band, it means “measurement inaccuracy” is masking “manufacturing inaccuracy,” and process-improvement efforts may be misdirected.
2. Why 3D Printing Is More Sensitive to Measurement Systems
Compared with traditional machining, additive manufacturing imposes stricter requirements on measurement systems for three reasons. First, geometric complexity is high. Conformal cooling channels, thin-wall lattices, and internal cavities cannot be measured directly with calipers; they require coordinate measuring machines (CMMs) or industrial CT. CT voxel resolution, beam energy, and reconstruction algorithms can all introduce systematic deviation. Second, surface roughness is high. Powder bed fusion (PBF) parts have granular surfaces, and the contact force from stylus roughness testers or CMM probes can cause readings to fluctuate. For unpolished parts, Ra values often vary by more than 15% from the true value. Third, anisotropy and build-orientation effects matter. Dimensional shrinkage differs along and perpendicular to the build direction. If sampling and measurement datums are not standardized, parts from the same batch may be incorrectly judged out of tolerance. Together, these factors often make “measurement error” comparable in magnitude to “process error,” so MSA is required to separate them.
3. Engineering Practices for Gauge Calibration and Interim Checks
The first step toward trustworthy data is controlled gauges. Companies should establish a three-level gauge register: Class A equipment, such as CMMs, industrial CT systems, and optical measuring instruments, should be sent for periodic verification according to national metrology procedures and traceable to length standards; Class B tools, such as digital micrometers, height gauges, and roughness testers, should be calibrated with stated uncertainty; Class C tools, such as inspection fixtures and go/no-go gauges, should undergo functional verification. The key is not simply “whether there is a certificate,” but whether the calibration interval covers drift. For example, wear on ruby probes and aging of air-bearing guideways can cause a CMM to develop a 2–3 μm trending drift within six months; relying only on annual inspection may miss it. A more practical approach is to introduce Interim Checks: use a gauge block or standard sphere with known dimensions to verify key gauges weekly, and immediately suspend use if an out-of-tolerance condition is found. lantu3D’s quality inspection line uses this method to reduce the detection time for gauge loss of control from several months to within one week.
4. GR&R and How to Judge Data Credibility
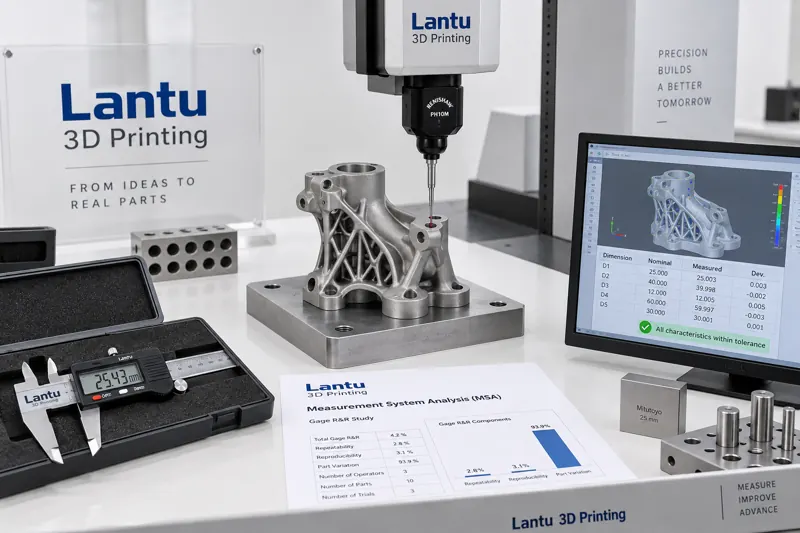
After gauges are controlled, GR&R is still needed to quantitatively answer how much confidence can be placed in a batch of data. In a typical crossed study with three operators, ten parts, and three repetitions, the calculated %GR&R, meaning R&R variation divided by the tolerance band, should be used as a release criterion: below 10% indicates an acceptable measurement system; 10%–30% may be conditionally acceptable depending on application criticality and part risk; above 30% requires corrective action on the gauge or method before remeasurement. For precision mating parts with a tolerance of only ±0.05 mm, even a %GR&R of 15% may be unacceptable. In that case, a higher-resolution measurement method or a non-contact method should be used. It is important to note that MSA evaluates “measurement,” not “manufacturing.” Only when GR&R is acceptable and Cpk is low can one be confident that the problem truly lies in the process rather than the gauge. This is a key basis for preventing rework before quotation and production commitments.
5. Implementation Points and Common Pitfalls
When implementing MSA, three key points and pitfalls deserve emphasis. First, samples must cover process variation. The ten selected parts should span the upper and lower dimensional limits, rather than being ten good parts that “look the same”; otherwise, GR&R may be artificially underestimated. Second, resolution must be sufficient. Gauge resolution should be no greater than one-tenth of the tolerance band. Using a probe with 1 μm resolution is meaningful when controlling a 0.1 mm tolerance. Third, do not confuse calibration with MSA. Calibration only proves that the gauge is aligned with a standard; MSA proves that the gauge can provide stable and trustworthy data on the production floor. Both are indispensable. Other common mistakes include performing MSA only after customer complaints, generating reports automatically with software without understanding sources of variation, and treating CT voxel error as a real defect, leading to over-rejection. These issues must be clearly defined in measurement work instructions and reinforced through training.
Conclusion
For a 3D printing company positioned around “from blueprint to delivery,” Measurement System Analysis is not an extra burden for the quality inspection department; it is the data foundation for all quality decisions. By establishing tiered gauge registers, carrying out interim checks, conducting regular GR&R studies, and incorporating resolution and sample representativeness into operating procedures, companies can remove “measurement inaccuracy” from the noise that interferes with process improvement, making FAI, SPC, and traceability data truly reliable. When data is trustworthy, quality improvement has direction, and customer trust has a solid foundation.
Submit a model, drawing, image or written notes. Engineers will review material, process, finishing and delivery based on actual use.