
Introduction: Why Quotes Are So Often “Inaccurate”
In 3D printing service businesses, one of the most common questions is: when the same machine and the same material are used, why does Customer A’s order make a profit while Customer B’s order quietly loses money? Most companies still rely on a rough costing model of “material cost + machine-hour cost,” allocating indirect costs such as equipment depreciation, facility rent, quality inspection labor, and software licenses evenly across orders based on printing hours. In low-volume, high-mix scenarios, this approach creates systematic distortion: an order with a short build time but three rounds of manual support design is allocated far less overhead than the resources it actually consumes; meanwhile, a simple batch part requiring no intervention ends up carrying process development costs it should not bear. The result is a quotation system that appears consistent, while the real profit structure is completely distorted.
1. The Basic Logic of Activity-Based Costing (ABC)
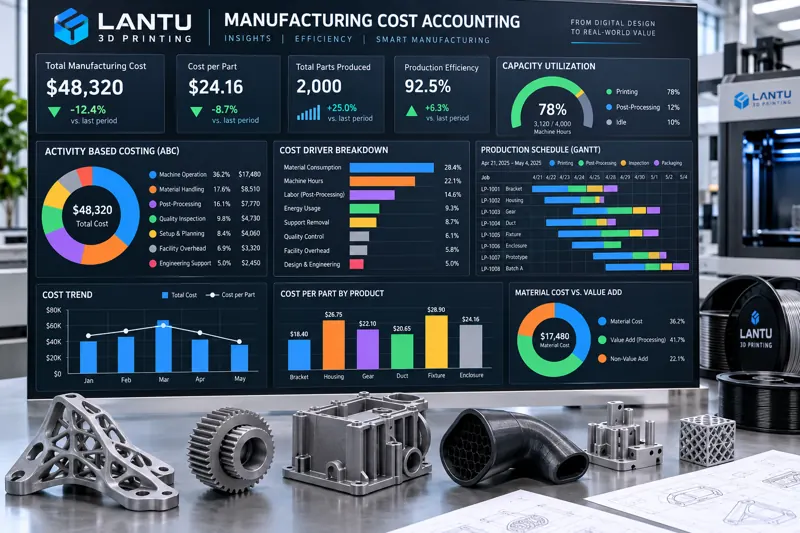
The core idea of activity-based costing is a two-stage allocation of “resources → activities → products.” First, the resources invested by the company, such as labor hours, equipment depreciation, energy, software, and floor space, are allocated to specific activity centers using resource drivers. Then, the costs of those activity centers are assigned to each order using activity drivers. Resource drivers answer the question “Who consumed this resource?” For example, a process engineer’s time may be divided among four types of activities: model repair, support design, process review, and exception handling. Activity drivers answer the question “Who triggered this activity?” For example, the driver for process review may be the number of review rounds, while the driver for support design may be model complexity or support volume.
For 3D printing services, typical activity centers include model receipt and design-for-manufacturing checks, model repair and support design, production scheduling and nesting, printing, depowdering and support removal, post-processing such as blasting, polishing, dyeing, and heat treatment, inspection and reporting, packaging and shipping, and after-sales and exception handling. Each center has measurable driver units, such as repair labor hours, build counts, printing hours, number of parts depowdered, inspection items, and shipment orders.
2. Identifying and Quantifying Cost Drivers
The key to identifying drivers is finding measurement units that are truly linearly correlated with cost generation. Several driver choices have proven effective in practice:
1. Printing activity: The driver should not simply be “printing hours.” For a 10-hour build, the depreciation cost assigned per part can differ by dozens of times depending on whether the build contains 80 small parts or only 2 large parts. A more reasonable driver is “occupied build volume × time” or “number of printed parts × projected area per part,” so that equipment time cost is truly allocated according to capacity occupation.
2. Depowdering and support removal: The driver is “number of parts × internal cavity complexity coefficient.” Parts with conformal channels or lattice structures can take 3–8 times longer to depowder than solid blocks. Allocating cost evenly by part count will seriously underestimate the cost of complex parts.
3. Inspection activity: The driver is “number of inspection items + reporting hours.” The cost difference between a full-dimensional CMM inspection report and a visual sampling inspection can exceed fivefold. Mixing them in one cost pool will inevitably distort results.
4. Process review activity: The driver is “number of review rounds.” First orders from new customers often require two to three review rounds, while repeat orders approach zero. This is the real reason why margins on first orders from new customers are thin, rather than simple price concessions.
3. Capacity Utilization: The Overlooked Hidden Cost Multiplier
There is one variable in the ABC model that is very easily overlooked: actual capacity utilization. Equipment depreciation and maintenance costs are fixed. If they are allocated based on a theoretical annual operating time of 7,200 hours, the equipment cost per hour may be 180 yuan. But when the actual load is only 55%, or about 4,000 operating hours per year, the same fixed cost is spread over fewer hours and rises to 320 yuan per hour, nearly doubling. This means the cost basis of the same quotation can be completely different between peak season and off-season.
Therefore, refined costing should distinguish between “standard cost” and “actual cost.” Standard cost is set based on a target capacity utilization rate, such as 75%, and is used as the basis for external quotations. Actual cost is calculated based on the real utilization rate during the period and is used for internal business analysis. The difference between the two is the capacity variance, which should be shown separately rather than quietly absorbed into unit pricing. When management sees a persistent negative capacity variance, the right response is to adjust production scheduling or increase order density, not to ask sales to cut prices.
4. Cost Visibility for WIP and Closed-Loop Work Orders
3D printing orders often span multiple days and multiple processes. If there is no record of cost retention in work in progress (WIP), costs can only be recognized all at once upon delivery, leading to a loss of process control. It is recommended to record three accounts at the work-order level: material cost already invested, based on actual powder consumption including sieving loss and reuse ratio; activity labor hours already consumed, recorded separately by activity center; and overhead allocated for the current period. When the work order is closed, the sum of these three items forms the actual order cost, which can be compared with the quotation to calculate the real gross margin.
There is a common management blind spot here: powder reuse. The price difference between virgin powder and reused powder can reach 30%–50%. If a work order only records “how many kilograms were used” without distinguishing the batch status of the powder, gross margin analysis will be distorted. It is recommended to mark the batch number and virgin-powder blending ratio during material issuance and include them as cost drivers in the costing process.
5. Implementation Path and Practical Recommendations
Switching from rough allocation to ABC does not need to happen all at once. A three-stage rollout is recommended. In the first stage, split the current “single large pool” into 5–7 activity centers, using the easiest drivers to collect at first, such as labor hours, part counts, and occurrence counts. In the second stage, add the capacity utilization parameter, make fixed costs dynamic based on actual load, and introduce variance analysis between standard cost and actual cost. In the third stage, connect work-order-level WIP cost retention to make order gross margin visible during execution rather than only through after-the-fact reporting.
It should be noted that the accuracy of ABC depends on the cost of data collection itself. Recording more than a dozen drivers for a small part worth only a few dozen yuan may create management costs that exceed the benefits of costing accuracy. A reasonable approach is tiered costing: standard parts and low-value orders use a simplified model, while high-value parts, first-order parts, and complex parts use the full ABC model. Using the 80/20 principle, costing precision should be focused on the 20% of orders that truly affect profitability.
Conclusion
Cost distortion in 3D printing services is not essentially a matter of “miscalculating material cost.” It comes from using a single allocation basis that hides the real differences in resource consumption across orders. Activity-based costing uses two-stage allocation through resource drivers and activity drivers to make hidden consumption such as process review, depowdering, inspection, and exception handling visible. When capacity utilization and WIP cost retention are added, companies can truly see which build is profitable and which customer is worth long-term investment. As a full-lifecycle management platform from blueprint design to physical delivery, lantu3D embeds the activity-based costing model into order review and production scheduling, enabling quotations to be based on traceable activity data rather than experience-based estimates. This is not only a requirement for refined financial management, but also a prerequisite for fulfilling delivery commitments.
Submit a model, drawing, image or written notes. Engineers will review material, process, finishing and delivery based on actual use.