
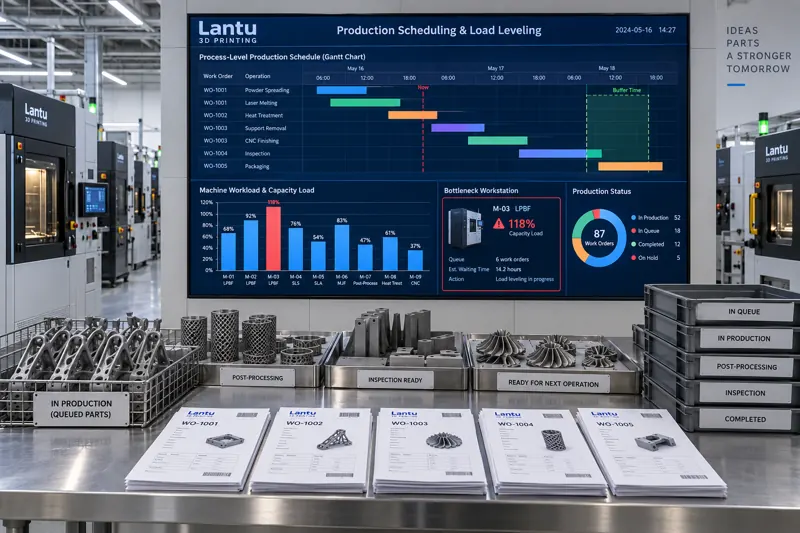
Introduction: Why “Finishing the Schedule” Still Leads to Daily Firefighting
Many additive manufacturing shops appear to have complete schedules: every machine has orders assigned each day, start times, and committed delivery dates. Yet the shop floor still faces daily firefighting—rush orders are pushed to the front, one machine sits idle while another has six work orders queued up, and promised delivery dates are repeatedly postponed. The problem is usually not that schedulers are not working hard enough; rather, the schedule is built on an assumption of “infinite capacity.” It answers only “which work order should be processed first,” not “after accounting for changeovers, post-processing, inspection, and rework, can this machine actually accommodate another order?”
Finite Capacity Scheduling (FCS) is an engineering approach that upgrades scheduling from a sequence list to a capacity-loading plan. It incorporates the actual occupancy time of every operation, machine availability calendars, staffing shifts, tooling and fixture constraints, and material-completeness status, then produces a plan that can both be executed and verified.
1. The Difference Between Infinite and Finite Capacity Scheduling
Infinite-capacity scheduling lays an order's operation chain across a timeline, checking only the logical sequence between upstream and downstream operations. It does not check whether a resource is assigned more than once at the same time. The resulting delivery date is often a “theoretical earliest completion date” that is nearly impossible to meet on an actual shop floor.
Finite-capacity scheduling, by contrast, assigns every operation to a specific resource—machine, workstation, operator, or fixture—and accumulates the resource load within the same time window. When the accumulated load exceeds available capacity, the scheduling engine must make a choice: postpone the work, use another machine, outsource it, or renegotiate the delivery date with sales. This mandatory decision mechanism is precisely what infinite-capacity scheduling lacks.
For 3D printing shops, this issue is amplified. The occupancy of a metal LPBF machine involves far more than printing itself: powder spreading and atmosphere purging, the build process, depowdering and part removal, support removal, heat treatment, wire EDM, blasting, and inspection. Each stage uses different resources and can vary substantially in duration. Scheduling only the printing operation excludes more than 70% of the actual workload from the model.
2. Building an Operation-Level Time Model: From Experience-Based Estimates to Calculable Data
The foundation of finite-capacity scheduling is operation-level standard time. The following approach is recommended:
1. Printing time. Do not use a rough estimate of “part quantity × per-part duration.” Actual time = recoating preparation + interlayer scanning time + build-platform cooling + part removal and depowdering. Scanning time can be estimated from slicing software output, while the other three elements should use measured averages by machine type. On a typical four-laser metal system, non-printing occupancy commonly accounts for 25%–40% of total machine time per build.
2. Post-lavorazione time. Heat treatment should be scheduled by furnace batch rather than by part quantity, since multiple parts can be loaded together but are constrained by furnace volume and process profiles. Wire EDM, blasting, and inspection should be scheduled by part. The key is to establish a “furnace-batch capacity” parameter; otherwise, the schedule will treat every part as if it requires an entire furnace.
3. Changeover and setup time. Material changes, recoater changes, support-parameter adjustments, and recalibration are all changeovers. In practice, a powder change on metal equipment—including powder sieving, machine cleaning, and atmosphere purging—often takes 2–4 hours; changing a material spool on polymer equipment typically takes 30–60 minutes. If changeovers are not modeled, the schedule will systematically underestimate workload.
4. Probabilistic time for rework and scrap. Based on historical yield, add an expected rework time to each operation. For example, with a 95% build yield, expected rework time = per-part processing time × 5%. This is not pessimistic planning; it incorporates known statistical reality into the schedule.
3. Capacity Loading: Determine Whether Work Can Fit Before Scheduling It
Once operation times are established, capacity loading can be calculated. The core formulas are straightforward:
Operation load (hours) = Σ (standard time for each work order at the operation + changeover time + expected rework time)
Available resource capacity (hours) = calendar hours × availability rate × shift factor
Load rate = operation load ÷ available resource capacity
A practical engineering guideline is as follows: a load rate above 100% requires postponement or rerouting; a sustained rate of 85%–95% indicates that the machine is a bottleneck with no buffer, so any disruption will immediately become a delay; a rate below 60% requires checking whether scheduling rules are overly conservative or the order mix is unbalanced.
Availability rates should not be guessed. Use actual data from the previous three months: available operating hours ÷ calendar hours, after deducting planned maintenance, unplanned downtime, material waiting time, and inspection waiting time. Many shops believe their availability is 90%, while measured performance is only 72%—this single parameter can explain much of the delivery-date variance.
4. Operation-Level Gantt Charts and Buffer Management
The output of finite-capacity scheduling should be an operation-level Gantt chart: time runs along the horizontal axis, each row represents a resource—machine, workstation, or operator—and each colored block represents an operation. Block length should equal calculated processing time rather than an “ideal duration.” Bottlenecks then become immediately visible: the resource with uninterrupted blocks and downstream operations constantly waiting is the constraint that requires priority management.
Buffers must be established on top of the Gantt chart. A two-tier buffer system is recommended: a due-date buffer is placed at the end of the order to absorb the impact of process variability on the committed date, while a bottleneck buffer is placed before the bottleneck operation to ensure it never runs out of work. Buffer consumption is one of the most effective early-warning indicators. When more than 50% of the due-date buffer has been consumed while physical progress is below 40%, the order should be flagged as at risk and the customer should be proactively notified, rather than waiting until three days before shipment to reveal the issue.
5. Material Shortages and Rush Orders: The Two Most Common Sources of Schedule Distortion
Material shortages. A schedule may assume that materials are complete, but an uninspected powder batch, an unavailable build plate, or a queue at an outsourced heat-treatment provider can prevent a supposedly ready work order from starting. The solution is to add a “material-completeness status” gate for every work order: the powder lot has an inspection report, the build plate is in stock, tooling is available, and the outsourcing time slot is confirmed. Only when all four conditions are met may the order enter the schedulable pool. The shortage list should be updated daily on a rolling basis, rather than discovered on the scheduled start date.
Rush orders. Moving an urgent order to the front is essentially a local optimization that bypasses scheduling rules. The correct approach is not to prohibit rush orders, but to assign them an explicit cost. A rush order must be assessed for its impact on the delivery dates of work already in process—how many orders are affected and by how many days—and must explicitly consume bottleneck buffer. The scheduling engine should be able to output a “before-and-after rush-order comparison,” allowing decision-makers to choose with full knowledge of the trade-off instead of having the shop floor compete for equipment based on intuition.
A schedule freeze period should also be defined. For example, the sequence of started work orders in the next 48 hours can be frozen, and any changes during that period must go through approval. Without a freeze period, the schedule will always be disrupted immediately after it is created, rendering capacity calculations meaningless.
6. Closing the Loop with Metrics: OTD, Schedule Attainment, and Scheduling Variance
Completing a schedule does not mean management is complete. Track the following three metrics and review them weekly:
1. On-Time Delivery (OTD). Measure against committed order dates, distinguish between customer-related and internal causes, and assess only delays caused by internal factors.
2. Schedule attainment. Actual completed operations ÷ planned completed operations, measured by resource group. This metric directly indicates whether the time model is accurate.
3. Scheduling variance. The distribution of variance between actual and standard time. If an operation consistently has positive variance exceeding 20%, revise its standard time instead of continuing to pressure the shop floor.
All three metrics must be viewed together. Poor OTD with high schedule attainment indicates an overly optimistic time model or overly tight delivery commitments. Low schedule attainment with acceptable OTD indicates that the shop is relying on overtime and rush-order interventions to hold performance together, while risk is accumulating.
Conclusion
Finite-capacity scheduling is not a project that delivers results simply by purchasing software. Fundamentally, it requires the shop to translate “experience” into “parameters”: operation-level times, equipment availability, changeover time, furnace-batch capacity, material-completeness prerequisites, and buffer policies. These parameters will inevitably be inaccurate at first, but with schedule attainment and scheduling variance as feedback, they can converge to usable accuracy within three months.
For a full-lifecycle management platform such as lantu3D, covering everything from design blueprints to physical delivery, the value of a schedule lies not in how fully it is packed, but in whether it can be verified, held accountable, and continuously improved. Transforming a schedule from a sequence list into an engineering document with capacity loads, buffers, and variance feedback is what turns delivery dates from a “promise” into a calculable outcome.
Invia un modello, un disegno, un'immagine o note scritte. Gli ingegneri valuteranno materiale, processo, finitura e consegna in base all'uso effettivo.