
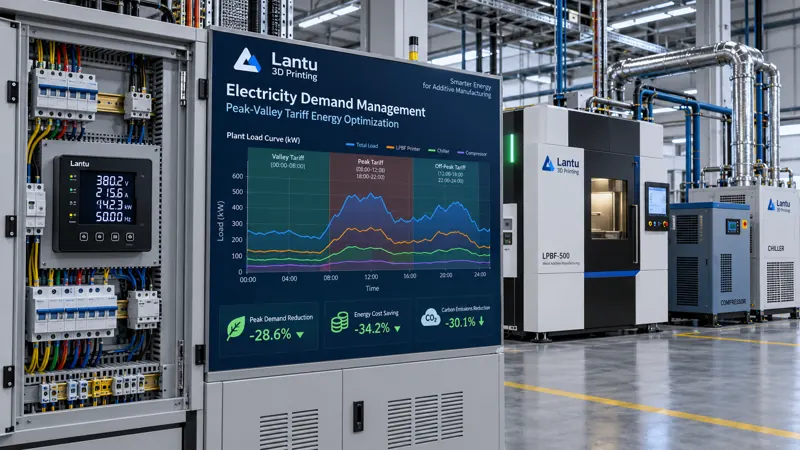
Introduction: Two Charges on the Electricity Bill, but Most Workshops Focus on Only One
An industrial electricity bill generally consists of two components: an energy charge and a basic charge. The former is billed according to actual electricity consumption (kWh), while the latter is based on the month's maximum demand (kW) or transformer capacity. Most 3D printing workshops focus all energy-saving efforts on reducing kWh consumption while overlooking demand charges. A single simultaneous startup of all equipment, or a ten-minute overlap between one oven and two metal printers during the morning shift, can increase monthly maximum demand by more than 30%, with the resulting charge remaining in effect throughout the subsequent billing cycle.
Time-of-use pricing is an even more immediate concern. In most regions, commercial and industrial tariffs divide the day into critical peak, peak, shoulder, and off-peak periods, with price differentials between critical peak and off-peak periods commonly reaching 2.5 to 4 times. For a metal LPBF system rated at 8 to 15 kW, moving an entire 12-hour build job to an off-peak period can reduce per-part electricity costs more than virtually any minor adjustment to process parameters.
1. Map the Load Profile Before Optimizing
Any electricity optimization initiative must begin with measurement. Install power meters with data-logging capability in the workshop's incoming distribution panel, using a sampling interval of no more than one minute and recording continuously for at least two weeks to cover a complete production week. Key metrics to extract include the shape of the daily load curve and the timing of peak demand, power consumption and startup/shutdown patterns for major equipment, base load during standby conditions, and the daily average and fluctuation range of the power factor.
Measured data typically reveal several common issues. The first is excessive base load: after a printer completes a build, heating systems, dust extraction fans, chillers, and air compressors may continue operating without intervention, causing nighttime base load to reach 40% to 60% of daytime consumption. The second is overlapping startup surges: multiple high-power devices are switched on together before a shift, creating the highest peak of the day. Although this peak may last only minutes, it determines the entire month's basic charge. The third is low power factor: workshops with numerous inductive loads often operate at a power factor of 0.75 to 0.85, below the utility's 0.90 assessment threshold, generating substantial monthly power factor adjustment charges.
2. Demand Management: Flatten Peaks Rather Than Simply Reducing Total Consumption
The core of demand control is staggered startup and shutdown combined with power-cap constraints. The approach can be implemented at three levels. The first is equipment-level interlocking: define permitted operating periods and concurrent operating limits for each category of high-power equipment in the workshop energy management system. For example, build systems and heat-treatment furnaces should not start simultaneously, while air-compressor and chiller compressors should not load within the same minute. Interlocking does not reduce total output; it only changes how power is distributed over time.
The second level is demand warning and automatic load shedding. Set an alarm threshold slightly below historical maximum demand, such as 90% of the historical maximum. When rolling average power approaches this threshold, the system automatically delays non-critical loads according to predefined priorities. Oven heating and powder drying, for example, can be postponed, whereas active printing jobs must never be interrupted. The third level is startup ramping: introduce high-power heating loads in stages to prevent transient surges caused by multiple heating elements being energized simultaneously.
3. Off-Peak Production Scheduling: Move Flexible Processes to Low-Tariff Periods
Not all processes can be moved freely. Rigid and flexible processes must be distinguished. Once a build begins, it must run continuously to completion; a power interruption means scrapped parts and lost powder. It is therefore semi-rigid: it cannot be interrupted, but its start time can be selected. Powder drying, sieving, part annealing, post-blasting operations, and washing and drying are not time-sensitive. These are fully flexible processes and should be scheduled preferentially during off-peak periods.
In practice, scheduling rules can be designed as follows: first, work backward from the delivery deadline to determine the latest permissible start time for each build job. If the beginning of the available off-peak period still allows the deadline to be met, schedule the build to start during the lower-tariff period. Schedule all flexible processes, such as annealing and drying, during off-peak and shoulder periods. During critical peak periods, retain only low-power activities such as inspection, assembly, and packaging. For a workshop with two metal machines, adjusting build-job start times alone can typically reduce monthly energy charges by 15% to 25%.
4. Power Factor and Equipment-Side Improvements
Low power factor should first be addressed at the equipment level rather than by directly installing a compensation cabinet. Common causes include motors operating under light load for extended periods, where power factor deteriorates significantly below a 40% load rate; high no-load losses in aging transformers; and harmonics generated by variable-frequency drives that cause measurement errors. Targeted measures include replacing heavily oversized motors that operate under light load, installing variable-frequency control on continuously operating fans and pumps, and deploying active harmonic filters on circuits with severe harmonic distortion. After equipment-side improvements are complete, if power factor remains below 0.90, centralized reactive power compensation can be installed in the electrical distribution room. Its capacity should be determined by the measured reactive power deficit to avoid overcompensation.
Equipment selection also offers optimization opportunities. When purchasing printing equipment, evaluate standby power rather than build power alone. Compared with a machine rated at 10 kW during building and 3 kW in standby, a machine rated at 11 kW during building but only 0.8 kW in standby may consume less electricity annually in low-utilization, small-batch applications. Similarly, chillers should feature load-adaptive control to avoid frequent cycling of fixed-speed compressors.
5. Establish an Actionable Closed-Loop Electricity Management System
Embedding these measures into routine management requires four elements. First is submetering: at minimum, separately meter build equipment, post-processing equipment, and utility systems including compressed air, chilled water, and dust extraction. Otherwise, the true source of energy savings cannot be determined. Second is performance metrics: establish energy consumption per part (kWh/part) and energy consumption per unit of production value, track both monthly, and compare them after normalizing for output. Third is anomaly alerting: automatically notify the responsible equipment owner when daily base load rises more than 15% above the historical average or power factor falls below 0.88. Fourth is a review mechanism: each month, break down the electricity bill into energy charges, basic charges, and power factor adjustment charges; attribute each to specific equipment and behaviors; and create an improvement list for the following month.
Conclusion
Electricity optimization in a 3D printing workshop is not fundamentally about using less power, but about using power at the right time and with the right load profile. Start by using submetering to understand the load curve and demand structure. Then flatten peaks through interlocking and load shedding, move flexible processes to off-peak periods through scheduling, improve power factor through equipment-side measures, and finally institutionalize improvement through energy-per-part metrics. This approach requires no major capital investment, yet can reduce electricity costs by a visibly meaningful amount while providing traceable source data for subsequent carbon-footprint accounting.
Invia un modello, un disegno, un'immagine o note scritte. Gli ingegneri valuteranno materiale, processo, finitura e consegna in base all'uso effettivo.