
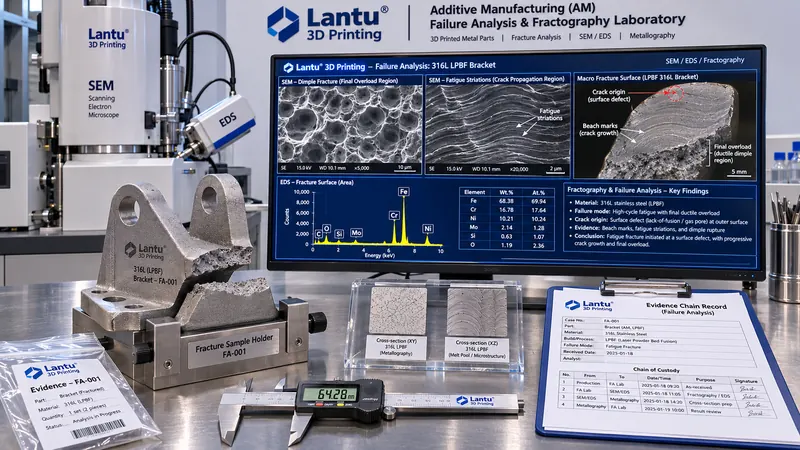
Introduction: A Liability Deadlock Triggered by a Fractured Part
A batch of laser powder bed fusion (LPBF) 316L stainless-steel brackets fractured at the mounting-hole root after approximately three months in service. The customer demanded responsibility attribution: was the issue related to the powder batch, drift in printing parameters, structural stress concentration, or overload during field assembly? The quality department retrieved process records, powder inspection reports, and mechanical-property test-coupon data for the batch, all of which were compliant. The customer service department completed containment and interim actions through the 8D process, yet still could not provide a technical conclusion as to “why it fractured and where cracking began.” This type of deadlock is common in additive manufacturing deliveries: root-cause analysis at the process level can answer “who will handle it,” but cannot answer “where the physical origin of fracture is.” What can truly resolve the dispute is fractography of the failed part itself, translating morphological evidence retained on the fracture surface into attributable process and design causes.
I. Distinct Roles of Fractography, Defect Prevention, Microstructural Characterization, and the 8D Process
Many companies equate “failure analysis” with a defect-investigation checklist or an 8D customer-complaint report. This is the most significant conceptual mismatch. The four approaches address entirely different subjects: build-defect analysis addresses balling, porosity, hot cracking, and distortion generated during printing, with the goal of suppressing defects; metallographic and microstructural characterization examines grains, melt-pool morphology, and phase composition in intact specimens, with the goal of validating the process; 8D root-cause analysis addresses management processes, producing corrective actions and responsibility assignments; fractography, in contrast, examines the actual fractured part and infers crack-initiation location, loading mode, propagation rate, and defect-source characteristics from residual plastic deformation, crack-propagation features, and final-fracture morphology on the fracture surface.
For 3D-printed parts, this analysis is particularly indispensable. Additively manufactured parts contain unique weak planes, including interlayer bonding interfaces, anisotropic microstructures, lack-of-fusion defects, and keyhole porosity. A compliant test-coupon report cannot prove the bonding quality of a specific part at a specific orientation and layer. The fracture surface is the only firsthand evidence of “how this specific part actually failed,” and the only physical basis for distinguishing responsibility among material, process, design, and service factors.
II. First Step in the Evidence Chain: Fracture Protection, Sampling, and Traceability Records
The stage most vulnerable to damage in fractographic analysis is not SEM observation, but the period before the failed part reaches the laboratory. The following practices must be formalized in work instructions:
1. Fracture-surface protection. After fracture, do not touch the surface by hand, mate the fracture faces, or blow them with compressed air. Remove loose dust by low-pressure rinsing with analytical-grade anhydrous ethanol (≥99.7%), allow the part to air dry immediately, then wrap the fracture faces with inert material, such as polyethylene film or clean filter paper, and place them in a rigid sample box to prevent secondary impact damage and oxidation during transport. If the surface has been contaminated with oil or corrosive media, it may be ultrasonically cleaned in acetone for 3–5 min at 40 kHz and ≤100 W; however, this must be documented because cleaning can remove some corrosion-product evidence.
2. Sampling and identification of both sides. Both A and B sides of the fractured part must be retained. Assign an overall identification number to the primary fracture surface, such as FA-2026-011-A/B, and remove comparative specimens 10–20 mm from the primary fracture for metallographic and hardness verification. Use wire EDM or low-speed precision cutting with a feed rate of ≤0.05 mm/s and sufficient coolant. The cut must be at least 5 mm from the fracture surface to prevent the heat-affected zone from altering the nearby microstructure.
3. Required record fields. Retain, at minimum: part number and batch number; printer identification and build-chamber position coordinates; recoating direction and actual build orientation; layer thickness, such as 30 μm; laser power, scan speed, and hatch spacing; powder batch number and reuse count; post-processing records, including stress-relief annealing, HIP, and machining; service conditions, including load spectrum, temperature, medium, and service duration; assembly torque records; six-view photographs of the fracture and a macroscopic panoramic image with a scale accurate to 1 mm. If any of these items is missing, subsequent attribution cannot be fully closed.
III. Macroscopic Morphology Interpretation: Locating the Crack Origin, Propagation Zone, and Final-Fracture Zone
Under a stereomicroscope, using 5–50× magnification, ring LED illumination, and an incident angle of approximately 30° to highlight topography, most metal fracture surfaces can be divided into three zones. Their area ratios and orientations provide direct loading information:
The crack-origin zone is typically located at a surface or near-surface defect. A convergence point of radial steps or chevron marks indicates the crack-initiation location; multiple origins suggest high stress levels or multiple defects. The crack-propagation zone is relatively smooth and may show beach marks or fatigue arcs. Their spacing increases with load amplitude; under low-stress, high-cycle fatigue, this zone can account for more than 70% of the fracture area. The final-fracture zone appears fibrous or contains shear lips. A larger area fraction indicates greater final overload; if the final-fracture zone exceeds 50%, assembly overload or a one-time impact should be suspected before material fatigue.
For additively manufactured parts, two additional features require attention. First, approximately horizontal, step-like planar morphology along interlayer boundaries indicates lack of fusion between layers or weak Z-direction bonding; the energy density and recoating condition of the corresponding layer should be reviewed. Second, a fixed angle between the fracture surface and the build orientation suggests cracking along a weak plane caused by anisotropy. By overlaying macroscopic photographs with build-chamber coordinates, the crack origin can be traced to a specific layer number and scan track, a critical step for comparison with a “batch qualification report.”
IV. SEM/EDS Microscopic Evidence: Translating Morphology into Failure Mechanisms
For SEM observation, an accelerating voltage of 15–20 kV, a working distance of 8–12 mm, and secondary-electron imaging are recommended. First locate the origin zone at low magnification, 100–500×, then progressively increase magnification in the origin area to 2,000–10,000×. The criteria are as follows:
Dimples: Equiaxed dimples correspond to uniaxial tensile overload, while parabolic shear dimples correspond to shear loading. Dimple size is positively correlated with material ductility; in annealed 316L, dimples are typically 1–5 μm. If spherical inclusions are visible at dimple bottoms, immediately perform EDS spot analysis on the inclusions. Cleavage and quasi-cleavage: River patterns and fan-shaped steps indicate brittle fracture, requiring review of oxygen/nitrogen content, lack of fusion, or low-temperature service conditions. Fatigue striations: Each striation generally corresponds to one stress cycle. Striation spacing can be used to estimate crack-growth rate, da/dN, typically on the order of 10⁻⁴–10⁻² mm/cycle. Combined with beach marks, striations can distinguish high-cycle fatigue from corrosion fatigue; corrosion-fatigue striations are often accompanied by secondary cracks and corrosion products.
Microscopic signatures of additive-manufacturing-specific defects: Lack of fusion appears as irregular, flattened depressions, with unmelted powder-particle morphology retained on the cavity walls. Such defects commonly range from tens to hundreds of micrometers, and EDS generally shows no anomalous elements. Keyhole pores are nearly spherical with smooth inner walls and typically measure 20–100 μm in diameter. Oxide inclusions show pronounced O, Al, Si, and Mn peaks in EDS and are commonly associated with excessive powder reuse or excessive oxygen content in the shielding gas. For LPBF, build-chamber oxygen content should preferably be controlled below 100 ppm and dew point below −40 ℃. EDS mapping with an acquisition time of at least 60 s should be used to identify elemental segregation and avoid misinterpretation based solely on a single point spectrum.
Different regions of the same fracture can exhibit different mechanisms: lack-of-fusion defects in the origin zone, fatigue striations in the propagation zone, and dimples in the final-fracture zone. This is the most typical composite failure pattern in additively manufactured parts. Reports should provide morphology images, magnifications, EDS spectra, and interpretation conclusions for each zone, rather than presenting only one “most representative” image.
V. Attribution Matrix: Mapping Evidence Back to Process, Design, Material, and Service
Once the evidence chain is established, responsibility attribution should be based on determinable criteria rather than qualitative descriptions. A four-factor attribution matrix is recommended:
Material-related attribution is supported when EDS detects anomalous inclusions associated with the powder batch or excessive oxygen content, similar origin-zone defects appear in other parts from the same batch, and powder Hall flow rate or particle-size distribution D50 deviates from the acceptance window for the grade, such as an excessive fraction of particles outside the 15–45 μm range. Process-related attribution is supported when the origin zone contains lack-of-fusion defects or keyhole pores that can be correlated with volumetric energy density below the lower process-window limit for that layer, for example, outside the commonly used 50–80 J/mm³ range for 316L, recoater-blade wear records, or abnormal shielding-gas flow at that chamber location; recurrence rates in same-batch parts at the same coordinates are also significantly higher. Design-related attribution is supported when the crack origin is located at a geometric sharp corner or hole edge, the fillet radius is below the recommended value relative to wall thickness, such as R ≥1.5 mm for thin-walled parts and R ≥2 mm at load-bearing hole edges, finite-element analysis shows a local stress-concentration factor Kt >2, and no obvious material defects are present on the fracture surface. Service-related attribution is supported when the final-fracture zone accounts for a large proportion, assembly torque exceeds the technical agreement, non-design lateral loads are present, or corrosive media are involved, while material and process records remain within their respective windows.
The four factors are not mutually exclusive. Engineering conclusions should assign weights to primary causes and contributing factors and clearly classify each as “supported by evidence,” “insufficient evidence,” or “excluded.” Factors with insufficient evidence must be identified truthfully rather than being forcibly assigned merely to close the case.
VI. Corrective-Action Closure and a Reusable Checklist
The output of fractographic analysis must be translated into executable parameters and processes. Process-related outputs should include revised energy-density values for the relevant layer, recoater replacement intervals, and oxygen-content interlock thresholds. Design-related outputs should include fillet-radius and wall-thickness change notices, revision-controlled drawing updates, and first-article revalidation. Material-related outputs should include maximum powder reuse counts and incoming-inspection requalification items. Service-related outputs should include assembly-torque limits, load-spectrum instructions, and installation work instructions. Each action must be linked to a verification method, such as repeat builds of specimens at the same coordinates, comparative fatigue testing, or repeat fracture-surface examination, as well as a completion deadline. Before the closure report is issued, verification should be performed on retained samples from the same batch.
A minimum checklist that can be standardized includes: ① complete protection and identification of both fracture sides; ② scaled photographs showing macroscopic three-zone classification and crack-origin location; ③ complete low- and high-magnification SEM morphology of the origin zone; ④ retained EDS spot-scan and mapping spectra at defect locations; ⑤ correlation between the crack-origin layer number/coordinates and build records; ⑥ evidence status for every item in the four-factor attribution matrix; ⑦ corrective actions including parameters, verification methods, and responsible personnel; and ⑧ cross-references between the conclusions, 8D report, and batch traceability records. Only when all eight items are complete is a responsibility-attribution conclusion truly auditable.
Conclusion
For a platform such as lantu3D that covers the full lifecycle from design blueprints to physical delivery, a failed part is not merely a problem to be disposed of quickly, but the most authentic quality-feedback point. Defect prevention, metallographic characterization, and 8D processes each have their own roles, but only fractography can answer “at which layer, from which defect, and under what type of load did this part actually initiate cracking?” By standardizing fracture protection and sampling, macroscopic three-zone interpretation, SEM/EDS microscopic criteria, the four-factor attribution matrix, and corrective-action closure, companies can convert a single dispute into substantive upgrades to process windows, design rules, and acceptance criteria. This is the critical step from “being able to print” to being “determinable, traceable, and reusable.”
Invia un modello, un disegno, un'immagine o note scritte. Gli ingegneri valuteranno materiale, processo, finitura e consegna in base all'uso effettivo.