
Introduction: Replacing “Can It Be Made?” with “Should It Be Used?”
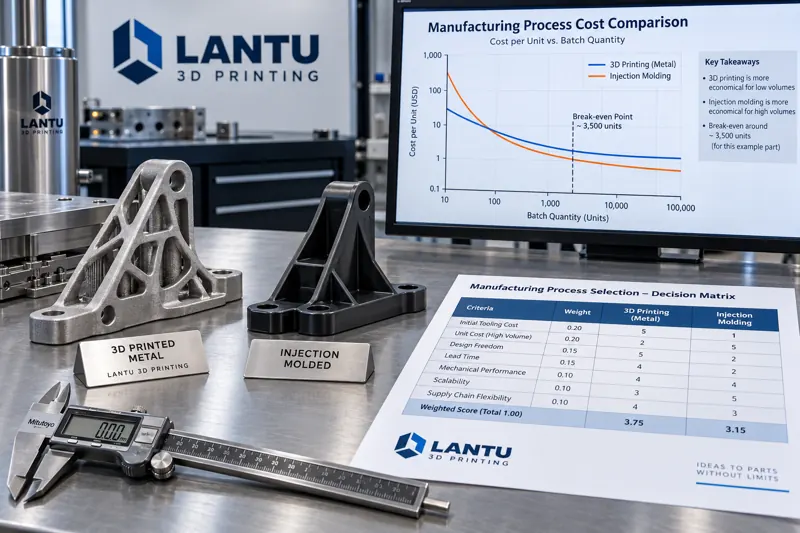
In additive manufacturing service settings, the question customers ask most often is, “Can this part be printed?” Yet what truly determines project success is usually not whether it can be printed, but whether additive manufacturing should be used to make it. lantu3D, a full-lifecycle management and implementation platform spanning blueprint design through physical-product delivery, has observed a recurring pattern across numerous delivery cases: when a part is technically fully printable but the wrong process route is selected, costs can be two or three times higher, lead times can be longer than with conventional processes, and quality risks can also increase. Therefore, this article shifts the discussion from process feasibility to a method for determining process-substitution boundaries. It provides a practical quantitative decision framework consisting of a quantity–complexity matrix, economic batch break-even points, a switching-cost checklist, and a validation loop from blueprint to physical product.
1. Why Substitution Boundaries Are Misjudged
Errors in substitution decisions typically stem from three cognitive biases. The first is “unit-cost bias”: comparing only quoted unit prices while overlooking one-time investments such as molds, fixtures, programming, and first-article setup. The initial mold investment for conventional injection molding or die casting may reach tens or even hundreds of thousands of yuan, whereas additive processes have virtually no mold cost. Their advantage becomes more apparent as batch size decreases and their disadvantage more pronounced as batch size increases. The second is “manufacturability bias”: equating geometric freedom with process advantage while ignoring practical constraints in dimensional accuracy, surface roughness, and consistency of material properties. The third is “cycle-time bias”: considering only print time while overlooking the total process duration of data preparation, support removal, heat treatment, machining, and inspection. Only by quantifying these three biases can substitution boundaries be engineered effectively.
2. The Quantity–Complexity Matrix: Locate First, Then Calculate
It is recommended to establish an initial screening method using two dimensions: annual demand volume and geometric complexity. Geometric complexity can be approximated using three measurable indicators: whether internal channels or hollow structures exist that cannot be machined with conventional tools; whether freeform surfaces account for more than 50 percent of total surface area; and whether the number of assembly parts can be consolidated into a single integrated component in one build. When annual demand is below 50 units and at least two of the above complexity criteria are met, additive manufacturing generally has a direct advantage. When annual demand is between 50 and 500 units, economic batch calculations are required. When annual demand exceeds 500 units and none of the complexity criteria are met, conventional manufacturing is almost certainly more economical. The purpose of this matrix is not to provide a final answer, but to narrow the discussion to the cell that requires detailed calculation.
3. Economic Batch Break-Even Point: Allocating One-Time Costs into Unit Prices
Calculating the break-even batch size is not complicated. Let the one-time investment for the conventional process—the total of molds, fixtures, programming, and first-article setup—be F. Let the variable unit cost of the conventional process be c1, and the unit cost of the additive process be c2, where c2 is typically higher than c1. When the total costs of the two processes are equal, the quantity N satisfies F plus N multiplied by c1 equals N multiplied by c2; thus, N equals F divided by the difference between c2 and c1. For example, assume that die-casting tooling and setup for an aluminum-alloy housing cost approximately 60,000 yuan, the die-cast unit cost is 22 yuan, and the additive unit cost is 260 yuan. The break-even batch size is then approximately 252 units. Below this quantity, additive manufacturing is more cost-effective; above it, die casting is more cost-effective. It should be emphasized that c2 is not fixed. It varies significantly with print orientation, packing density, support volume, and post-processing steps. Therefore, every comparison should be recalculated based on the actual build-layout plan rather than relying on historical unit prices.
4. Switching Costs: The Most Frequently Overlooked Category
The hidden costs of process switching often determine the final decision. The first category is data-reconstruction cost: redesigning topology for additive manufacturing, adjusting wall thicknesses, and defining machining allowances typically require one to three design iterations. The second is post-processing-chain cost: support removal, hot isostatic pressing or annealing, datum-surface machining, and surface finishing each add labor time and yield loss. The third is quality-validation cost: first-article qualification, nondestructive testing, full dimensional inspection, and material-property retesting. Particularly when a part is used in load-bearing or pressure-resistant conditions, validation costs may account for more than 15 percent of total project cost. The fourth is switching-fallback cost: if the additive route fails validation, the lead time and expense of reopening tooling must be estimated in advance. Only when all four cost categories are included in the same comparison sheet does the substitution decision become auditable.
5. Decision Criteria Checklist and the Validation Loop
It is recommended to formalize substitution decisions into a checkable list: whether annual demand volume and batch distribution are clear; measured results for the three geometric-complexity indicators; quotation support for one-time investment and unit cost of conventional processes; additive unit cost based on the actual build layout; post-processing and inspection process lists with labor hours; forward and reverse projections of delivery time; and failure modes and validation plans. Once the checklist is fully completed, proceed to small-batch trial production and first-article qualification, using measured data to calibrate model parameters. In its delivery system, lantu3D moves this closed loop forward into the blueprint stage, enabling design, process engineering, inspection, and delivery to be completed on a unified data chain and preventing the process route from being overturned only at the mass-production stage.
Conclusion
There is no absolute superiority between additive manufacturing and traditional manufacturing—only boundary conditions. A practical way to determine those boundaries is to first locate the opportunity using a quantity–complexity matrix, then calculate using a quantified break-even batch formula, fully incorporate switching and validation costs into the comparison sheet, and finally calibrate parameters through a closed loop of small-batch trial production. Upgrading the question from “Can it be printed?” to “Within what boundaries should additive manufacturing be used?” brings process decisions into a truly engineering-driven stage and ensures that every delivery from blueprint to physical product is based on accountable, reproducible, and auditable analysis.
Invia un modello, un disegno, un'immagine o note scritte. Gli ingegneri valuteranno materiale, processo, finitura e consegna in base all'uso effettivo.